Research article · OPEN ACCESS
Simulation Analysis of the "7·29" Flood Disaster in the Haihe River Basin: A Case Study of the Shisanling Town Upstream of the Shisanling Reservoir in Beijing
- 1China Institute of Water Resources and Hydropower Research, Beijing 100038, China
- 2The Water Diversion Project Management Bureau of the Haihe River Water Resources Commission of the Ministry of Water Resources, Tianjin 300392, China
- 3National Institute of Natural Hazards, Ministry of Emergency Management of China, Beijing 100085, China
- Received:
- Accepted:
- Published:
Abstract
The Haihe River Basin has experienced frequent floods from extreme rainfall in recent decades, with a catastrophic event striking the Beijing-Tianjin-Hebei region in July 2023. From July 29 to August 1, Liucun Town recorded 473.6 mm of rainfall, while the Wangjiayuan Reservoir station observed 744.8 mm, the highest in Beijing. This study examines the impacts of this flood in Shisanling Town, upstream of the Shisanling Reservoir, using a new-generation distributed hydrological model with calibrated parameters. Based on the “7·29” rainfall event, we simulated flood processes and assessed impacts on population and infrastructure, as well as reservoir discharge scenarios. Results indicate that under the “7·29” rainfall, Shisanling Town’s inundated area could reach 6.2 km², affecting 38 villages (excluding Yuling), with Beixin Village the most severely impacted (1.6 km² submerged). Approximately 2,935 people, 458 houses, 239.5 ha of orchards, and 105.4 ha of farmland would be affected. The flood peak, with an inflow of 1,627 m³/s and river depth of 7.2 m, would reach the reservoir within 48 h. Once the water level exceeds 93 m, a discharge of 80.05 million m³ is required. At the observed release rate of 30 m³/s, drainage would take 31 days. A full discharge downstream would inundate ~218 km² across nine towns, affecting ~650,000 people, 76,000 houses, 100+ road segments, 23,300 ha of farmland, 10 parks, and 16 schools. This study provides critical insights for flood prevention, reservoir management, and emergency evacuation planning in small watersheds under extreme rainfall conditions.
Keywords: Haihe River Basin;Flood Disaster;Simulation Analysis;Shisanling Reservoir;Flood Prevention and Mitigation
1. Introduction
Natural disasters are catastrophic events caused by natural forces such as earthquakes, volcanic eruptions, floods, droughts, typhoons, tsunamis, landslides and avalanches, which pose severe threats to human life, property, and social activities (Botzen, Deschenes, & Sanders, 2019). The frequency and intensity of natural disasters worldwide exhibit distinct spatial and temporal patterns under the influence of various factors such as climate change, geological structures and human activities (Eckardt et al., 2023; Abbass et al., 2022). In particular, climate change has increasingly disrupted ecosystems and human societies across the globe in unique ways (Ibarrarán et al., 2010; Guo et al., 2019). In recent years, the influence of climate change has become more pronounced, leading to a significant increase in the frequency and intensity of extreme rainfall events in many regions around the world (Papalexiou & Montanari, 2019). For example, the Sixth Assessment Report of the Intergovernmental Panel on Climate Change (IPCC) indicates the frequency of extreme rainfall events over most land areas has increased by 1-3 times compared with the average level during 1850–1900 (Bellos et al. 2020; Miller et al. 2014; Ni et al. 2021; Peng et al. 2015; Ban et al., 2024). In comparison to the period 1995–2014, it is projected that global annual land rainfall will increase by an average of 8.3% (ranging from 0.9 mm to 12.9 mm) under high-emission scenarios and by 2.4% (ranging from -0.2 mm to 4.7 mm) under low-emission scenarios by the end of the 21st century (Rentschler et al., 2022; Yu et al., 2023; Liu et al., 2020). When the extreme rainfall exceeds certain thresholds, it can result in severe flooding and waterlogging, causing casualties and substantial economic losses. Floods have become one of the most frequent and destructive natural disasters globally, with devastating impacts on human societies, economies and environments (Peng et al., 2020; Wu et al., 2018; Fang et al., 2015). Statistical data suggested that 1.81 billion people worldwide are directly threatened by 1-in-100-year flood events, including 1.24 billion in East and South Asia, and China has the highest population exposed, reaching 395 million people (Devitt et al., 2023; Cea et al., 2022).
In the context of global warming, extreme rainfall has increasingly affected many regions around the world, especially in developing countrie (Davenport et al. 2021; Doan et al. 2022; Shrestha et al. 2021). The climate in China is predominantly influenced by monsoons, which play a major role in the occurrence of flood disasters (Zou et al., 2021). Meanwhile rapid socioeconomic development and urban expansion have significantly altered the flood risk exposure and vulnerability in China (Bryan et al. 2018; Shu et al., 2023). In fact, China has faced the risk of frequent heavy rainfall events annually for a long period. Intense storms often trigger cascading disasters in rapid succession, e.g., urban waterlogging, river flooding, flash floods, debris flows and landslides (Guo et al., 2019; Ouyang et al., 2022). According to the global national-level flood risk maps, China ranks second in the world in terms of expected annual flood mortality risk and annual economic loss due to flooding (Ban et al., 2024).
In recent years, extreme rainfall events have occurred frequently across China. For instance, the “7·21” extreme rainfall in Beijing on July 21, 2012 (Chen et al., 2021), the North China extreme rainfall on July 19–20, 2016 (Fu et al., 2017) and the catastrophic Zhengzhou rainstorm on July 20, 2021 (Wang et al., 2022; Liu et al., 2024; Zhang et al., 2023) all caused severe secondary disasters such as flooding, landslides and urban waterlogging, posing serious threats to public safety and property. The Beijing-Tianjin-Hebei region in the Haihe River Basin experienced an unprecedented rainfall event from July 29 to August 2, 2023 under the combined influence of the residual circulation of Typhoon Doksuri (the fifth typhoon hitting China in 2023) and the subtropical anticyclone, resulting in severe regional flooding (Li et al., 2024; Li et al., 2023; Liu et al., 2023; Ma et al., 2025). The Chinese Ministry of Water Resources classified this event as a catastrophic flood in the Haihe River Basin. Changping District in Beijing was heavily affected, with severe rainstorm-induced flooding. In particular, Liucun Town in Changping District recorded an average rainfall of 473.6 mm, and the Wangjiayuan Reservoir meteorological station in the same area recorded a cumulative rainfall of 744.8 mm, the highest record in Beijing.
A large number of studies at home and abroad have been devoted to simulating and analyzing the mechanisms of flood disasters triggered by such extreme weather events (Ouyang et al., 2022; Hao et al., 2023). Most studies utilized hydrological models to estimate the peak flood discharge or hydrodynamic models to calculate the inundation depth (Wu et al., 2023; Luo et al., 2023). Researchers have developed various hydrological modeling frameworks, e.g., the grid-based Storage Capacity-Excess Infiltration (Grid-XAJ-SATIN) model (Du et al., 2022), the Xinanjiang–Haihe model (Li et al., 2025), and the Hebei rainfall-runoff model (Li et al., 2017; He et al., 2023). This study employed a new-generation distributed hydrological model, incorporating observed hydrometeorological data, to simulate the flood event caused by the “7·21” extreme rainfall in Liucun Town of Changping District, Beijing, which is located upstream of the Shisanling Reservoir. This study focuses on the flood development process in Shisanling Town and its impacts on exposed elements such as population and road infrastructure. Besides, this study evaluated the effects of reservoir discharge from the Shisanling Reservoir on downstream towns under the simulated scenario. Finally, targeted disaster mitigation measures and strategies are proposed with the aim of providing a scientific foundation and practical reference for flood disaster prevention and control, thereby enhancing regional flood resilience.
2. Study Area
2.1 Study Area
The study area is in Changping District, Beijing, with a total area of , 60% of which ( ) is located in mountainous or semi-mountainous areas. The terrain overall slopes gently from northwest to southeast. The western and northern parts are mountainous or semi-mountainous areas, where the western mountains known as the Western Hills belong to the Taihang Mountains and the northern mountains known as the Jundu Mountains belong to the Yanshan Mountains.
The study primarily focuses on Shisanling Town, which covers an area of 162.37 km, including 40 villages (communities), with a total population of 34,085 according to the Seventh National Population Census. This town has two small and medium-sized reservoirs, four small dams, six important mountain flood gullies, 10 geological disaster-prone villages, and 13 mountain flood disaster-prone villages. The geographical location of Shisanling Town is shown in Fig 1 (Zou et al., 2021).
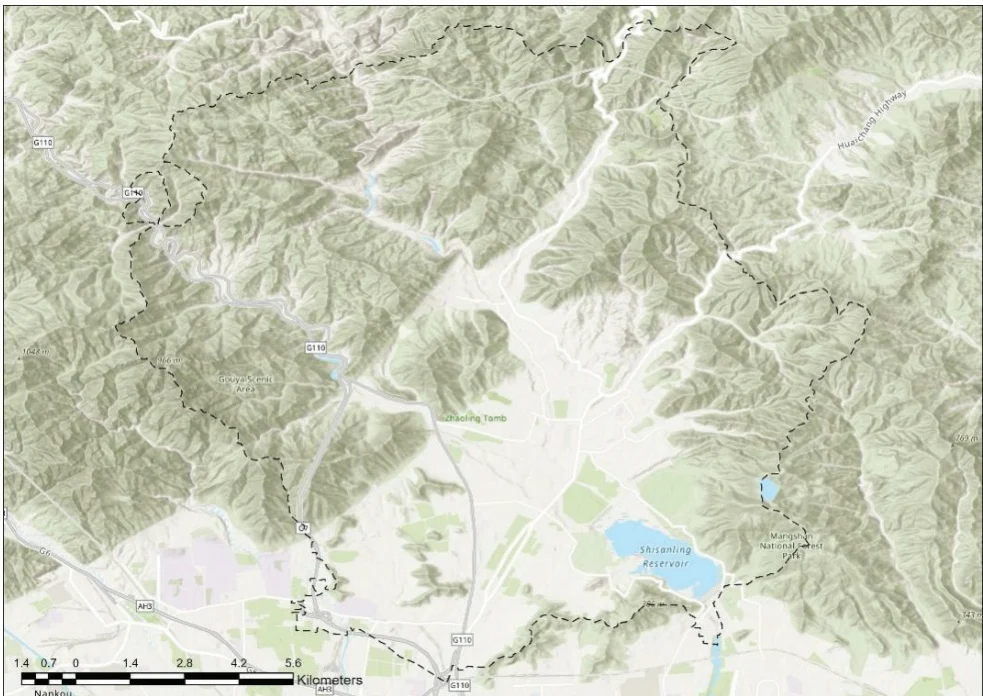
Fig. 1 The geographical location of Shisanling Town
2.2 Hydrometeorological and Flood Control Facilities
2.2.1 Rainfall Stations
There are 11 rainfall stations in Shisanling Town, i.e., Guozhuang, Kangling, Dalinggou, Apple Theme Park, Shisanling, Xiangtan, Changling, Deshengkou, Duijiuyu, Dazhuangke, and Changping Station, the spatial distribution of which is shown in Fig 2.
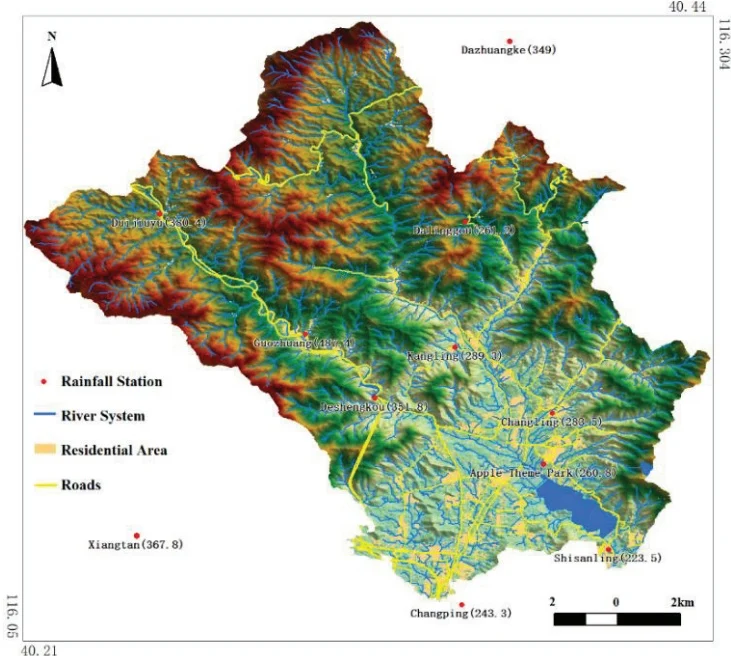
Fig. 2 Spatial Distribution of Rainfall Stations
2.2.2 River Network
The main rivers and gullies in Shisanling Town include Deshengkou Gully, Zhuishikou Gully, Shangxiakou Gully, and Laojuntang Gully, and their spatial distribution is shown in Fig 3.
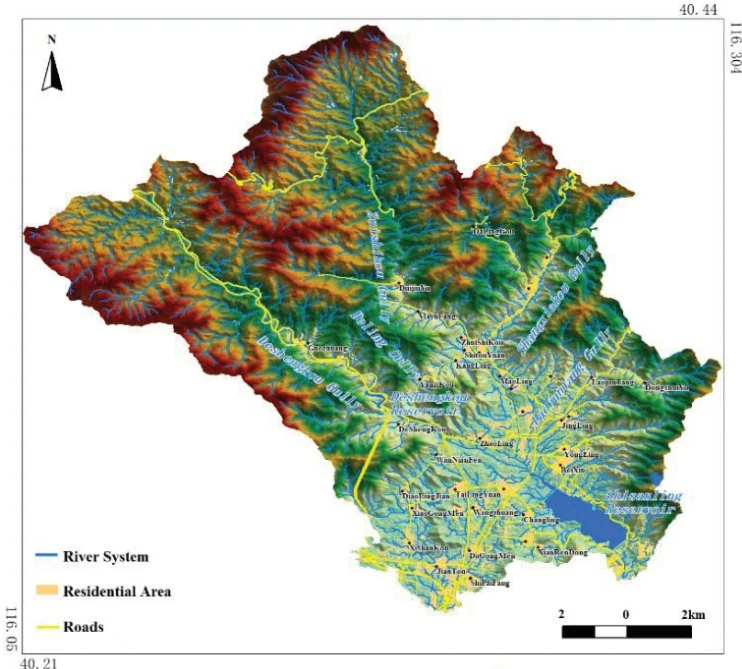
Fig. 3 River Network of Shisanling
2.3 Disaster-Bearing Entity Data
The permanent population and residential area of each village in Shisanling Town are summarized in Table 1.
Table 1. Demographics of the Shisanling Town
| Town Name | Village name | Resident population (persons) | Residential land area (million m2) |
| Shisanling Town | Beixin | 1701 | 38.63 |
| Shisanling Town | Huzhuang | 558 | 14.77 |
| Shisanling Town | Shipaifang | 411 | 11.40 |
| Shisanling Town | Jiantou | 2397 | 47.71 |
| Shisanling Town | Dagongmen | 1014 | 17.16 |
| Shisanling Town | Xianrendong | 686 | 8.45 |
| Shisanling Town | Nanxin | 1388 | 18.45 |
| Shisanling Town | Xishankou | 1654 | 27.75 |
| Shisanling Town | Changlingyuan | 757 | 15.73 |
| Shisanling Town | Kanglingyuan | 1092 | 16.44 |
| Shisanling Town | Xiaogongmen | 1031 | 11.21 |
| Shisanling Town | Wangzhuang | 299 | 6.61 |
| Shisanling Town | Tailingyuan | 1341 | 19.66 |
| Shisanling Town | Daolingjian | 715 | 7.69 |
| Shisanling Town | Wanniangfen | 473 | 6.39 |
| Shisanling Town | Deshengkou | 343 | 4.99 |
| Shisanling Town | Guozhuang | 776 | 9.82 |
| Shisanling Town | Jingling | 436 | 10.64 |
| Shisanling Town | Deling | 537 | 8.12 |
| Shisanling Town | Yongling | 755 | 8.11 |
| Shisanling Town | Zhaoling | 1045 | 16.35 |
| Shisanling Town | Xianling | 927 | 24.62 |
| Shisanling Town | Changling | 882 | 10.57 |
| Shisanling Town | Dongshuiyu | 136 | 1.92 |
| Shisanling Town | Qingling | 674 | 6.06 |
| Shisanling Town | Yuling | 411 | 3.21 |
| Shisanling Town | Laojuntang | 759 | 9.85 |
| Shisanling Town | Huangquansi | 280 | 3.03 |
| Shisanling Town | Maoling | 322 | 3.39 |
| Shisanling Town | Yanzikou | 278 | 2.97 |
| Shisanling Town | Kangling | 278 | 2.62 |
| Shisanling Town | Tailing | 855 | 11.83 |
| Shisanling Town | Shitouyuan | 222 | 3.32 |
| Shisanling Town | Zhuishikou | 433 | 5.80 |
| Shisanling Town | Mayufang | 229 | 2.31 |
| Shisanling Town | Xiakou | 624 | 9.66 |
| Shisanling Town | Shangkou | 768 | 6.31 |
| Shisanling Town | Duijiuyu | 492 | 7.60 |
| Shisanling Town | Dalinggou | 163 | 1.38 |
| Aggregate | 28142 | 442.53 | |
2.4 "7·29" Extreme Rainfall Scenario in the Liucun Town
During the "7·29" extreme rainfall event, the maximum rainfall was recorded at the Wangjiayuan Reservoir station, with a cumulative rainfall of 760.4 mm during July 29 and August 2, 2023, which is equivalent to a once-in-a-millennium design rainfall. This study selected the extreme rainfall process corresponding to the Wangjiayuan Reservoir station as the simulation scenario. The total rainfall and total net rainfall are shown in Fig 4.
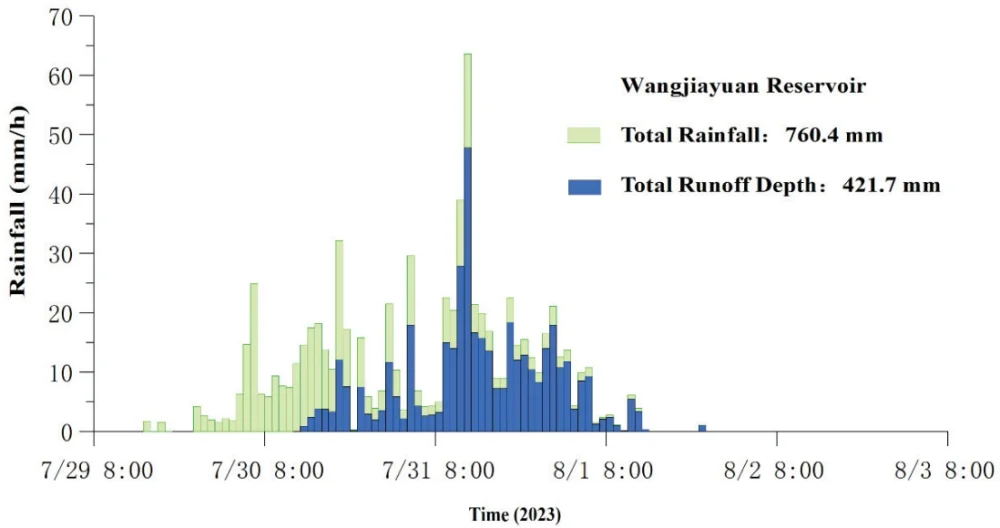
Fig. 4 Rainfall process at Wangjiazhuang Reservoir Station
3. Model Construction
3.1 Model Overview
This study used the new generation of distributed hydrological model developed under the leadership of Academician Changming Liu. Given the hourly time step of the measured rainfall data, it is difficult to guarantee the accuracy of the results based on the infiltration-excess or steady infiltration rate models. Therefore, the SCS-CN model was chosen for the runoff calculation in small watersheds (Mishra & Singh, 2003; Mishra & Singh, 2004; Ponce & Hawkins, 1996; Patil et al., 2008). The diffusion wave method was used for flow concentration simulation, and the implicit difference Aitken iteration method was used for flow concentration calculation (Ambrose & Wool, 1993).
3.2 Calculation Principles
This new generation of distributed hydrological models works on the basis of realistic river network interpretation according to high-resolution remote sensing images and flow direction maps derived from the digital elevation model (DEM). It incorporates three-dimensional actual river lengths, near-realistic cross-sectional shapes of river reaches, and slope units as key elements. Meanwhile this model uses implicit finite difference solutions of the diffusive wave equation in combination with Aitken iteration and spatiotemporal water flow transformation as its core routing techniques. It integrates multiple runoff generation models and achieves automatic and intelligent parameter calibration (Huang et al., 2013).
3.2.1 Generalization of the River Network as a "Reach-Node" System
The river network is generalized using the "reach-node" system of the DYNHYD (Ambrose & Wool, 1993) algorithm to facilitate the handling of complex, interconnected multi-crossing river networks. The generalized river network is shown in Fig 5.
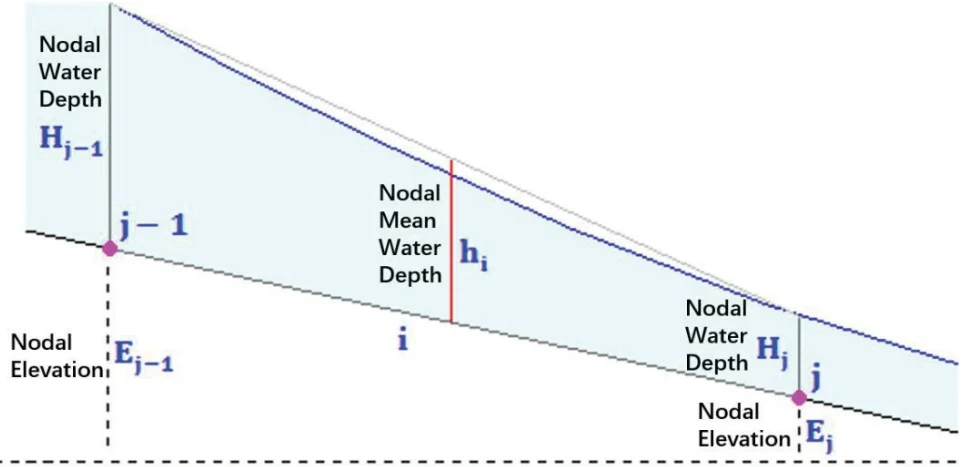
Fig. 5 Generalized River Network as a "Reach-Node" System
The formula for the surface area of a node is as follows:
where is the surface area of the th node; is the total number of river segments associated with the th node; is the width of the ith river segment; is the numerical step size of the river segment.
where at time, the water depth at node is calculated as the total flow divided by the surface area of the node (inflow is positive, outflow is negative), and the formula for water depth is:
where is the flow rate of the ith river segment in the jth node.
As for the th reach, with the upstream node as and the downstream node as , the average water depth of reach at time is:
3.2.2 Discretization of the Hydrodynamic Continuity Equation into Prediction and Correction Steps
The continuity equation was discretized into prediction and correction steps with the explicit finite difference upwind scheme, and the specific calculation formulas are as follows.
3.2.3 Discretization of the Hydrodynamic Momentum Equation into a Binary Linear Equation
The core of the method is that the hydrodynamic momentum equation is discretized into a binary linear equation with only one variable as follows:
where is the flow rate; is the cross-sectional area of the water flow; is the average water depth of the river section; is the roughness coefficient of the river section; is the water level of the river section; is the lateral flow rate of the river section; is the gravitational acceleration.
This equation is rewritten as a binary linear equation containing only the unknown variable and solved using the Aitken iteration method:
3.2.4 Inverse Solution of the SCS Runoff Model
In the SCS model, given the total rainfall and total net rainfall, the parameters and can be inversely solved. Let, then the SCS model can be rewritten as:
The solution is:
3.3 Hydrological and Hydrodynamic Model Construction
3.3.1 River Network Processing
The extraction of the river network was based on the interpretation of the actual river network from 1 m resolution remote sensing images in January 2020, in combination with the fusion of ALOS 12.5m resolution DEM. The small watershed was generalized into four elements, i.e., river segments, nodes, Fr slopes (source slopes), and In slopes (interval slopes).
River Width Measurement: The width of the main river was measured based on 1 m resolution remote sensing images, and the typical width of the remaining river segments was calculated using a catchment area model.
River Cross-Section: The cross-sectional area and hydraulic radius of the river channel were modeled using a power function, and an empirical exponent was used due to the lack of collected cross-sectional measurement data.
River Segment Slope: The slope of the river segments was calculated based on 5m interval contour lines, with the contour data derived from the ALOS 12.5m resolution DEM.
River Segment Length: The length of the river segments was calculated using a 20-degree zone number and a 6-degree zonal projection.
The generalized results of the river cross-sections in the small watershed of the Shisanling Town are shown in Fig 6.
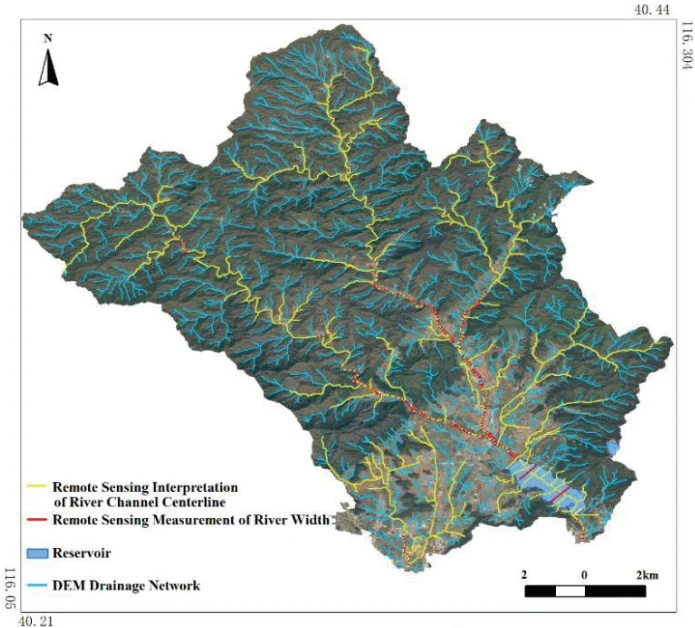
Fig. 6 The generalized results of the river cross-sections in the small watershed of the Shisanling Town
3.3.2 Hydrological Response Unit Division
The small watersheds in the Shisanling Town were divided into 13,039 river segments and 18,858 hydrological response units based on high-resolution remote sensing images and DEM-derived flow direction maps. The model construction results are shown in Fig 7.
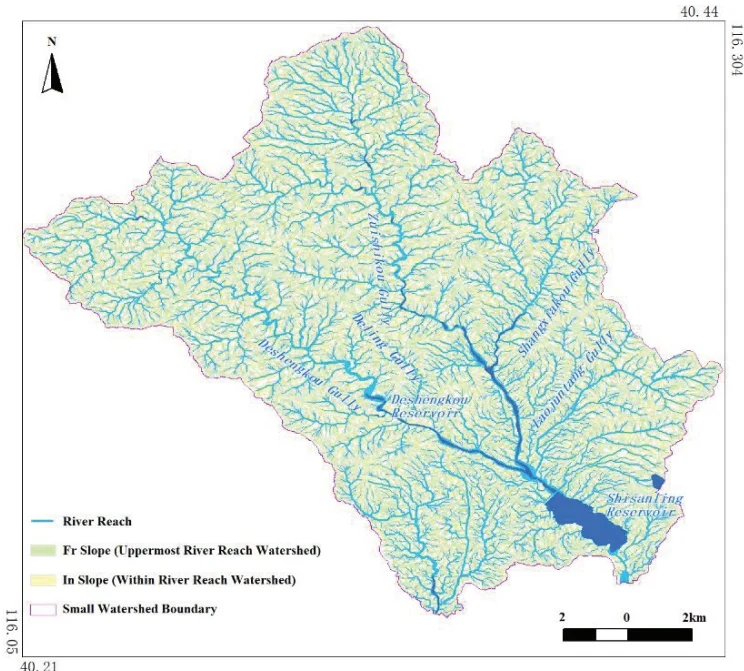
Fig. 7 The distributed hydrological model construction results of the Shisanling Town
3.4 Parameter Calibration
The hydrological model parameters were calibrated based on the inflow data of the Shisanling Reservoir. The specific calibration processes are as follows:
(1) Rainfall and flood events: The "7·29" rainfall and flood event occurred from 12:00 on July 29 to 00:00 on August 2, 2023. Rainfall data from 11 rainfall stations and inflow data from the Shisanling Reservoir were collected.
(2) Proximity and weight of rainfall stations: The Thiessen polygon and inverse distance squared weight method (Fig 8) (IDW) were jointly used to identify the proximity and weight of rainfall stations.
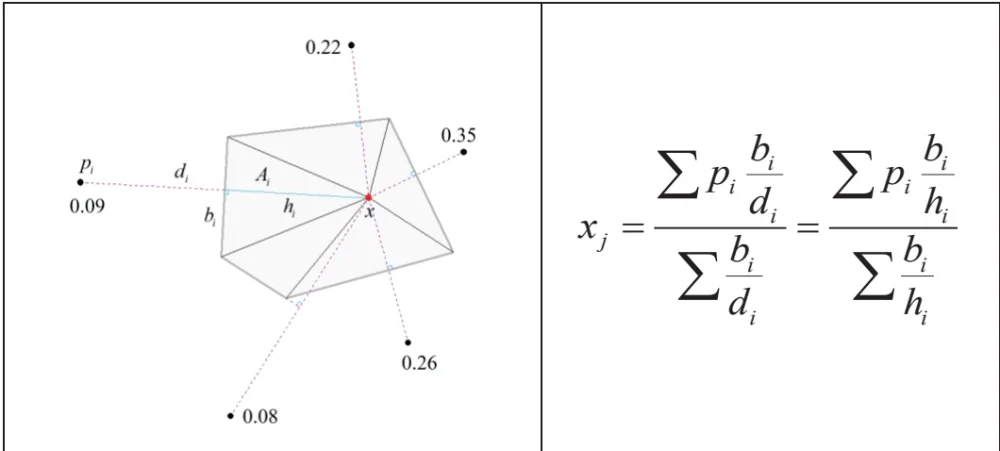
Fig. 8 Calculation schematic and formula of the combined weighting method
This study calculated the Thiessen polygons for all rainfall stations centered on the centroid points of each hydrological response unit. Assuming all vertices of the Thiessen polygons are the neighboring rainfall stations of the hydrological response unit, the weight of each neighboring rainfall station is determined by dividing the area of the triangle formed by the edges of the Thiessen polygon and the connecting lines to the centroid point by the square of the distance.
(3) Calculation of total rainfall depth and runoff depth: The total rainfall depth of the "7·29" storm flood in the controlled watershed of the Shisanling Reservoir was estimated to be 329.5 mm, and the runoff depth was estimated to be 85 mm.
(4) Selection and Calibration of the Runoff Generation Model: This study ultimately selected the SCS runoff generation model from the GA, excess infiltration and SCS runoff generation models in the hydrological model. The reason is that the collected rainfall data were primarily hourly rainfall, which smoothed the actual rainfall intensity and were significantly lower than the saturated hydraulic conductivity of 27 mm/h derived from the soil data.
The SCS runoff generation model was transformed into:
This study assumed the initial loss coefficient ranges between 0.01 and 0.50 and performed iterative calculations with a step size of 0.01. The parameters of the SCS runoff generation model that match the total rainfall depth of 329.5 mm and the runoff depth of 85 mm were determined as follows: initial loss coefficient = 0.3, and potential maximum retention = 313.5 mm.
(5) Overwater cross-section and hydraulic radius
This study assumed the relationship between the area of the overwater cross-section of a natural river and the water depth and the relationship between the hydraulic radius and the water depth can be modeled as a power function:
where A is the cross-section area; h is the water depth; b0 is the width coefficient; c0 shape index.
Since no large cross-section measurements of the river in the study watershed were collected, this study used the general parameter values of rivers in the northern mountainous area as follows:
(6) Roughness coefficient
This study took the range of slope roughness coefficient = [0.05,0.40], the range of channel roughness coefficient = [0.03,0.10], the simulation time step = 60s, the simulation space step = 10m, and this study used the diffusion wave implicit differential Aitkin iterative convergence. After a large number of parameter sets were calculated, the results of matching runoff observation data were obtained as follows: slope roughness n=0.1, and river section roughness n=0.05*k-0.09, where k is the topological catchment order of the river section from top to bottom.
(7) Parameter calibration
The raw inflow runoff data for the Shisanling Reservoir had a time interval of 0.5 hours and exhibited high fluctuations. Therefore, this study applied a moving average over three consecutive values to smooth the data. The error analysis between the smoothed measured discharge and the simulated results is as follows: peak flow error is 2.62%, peak time error is 6.25%, and total flood volume error is 0.01%. The model achieved a Nash–Sutcliffe efficiency coefficient of 0.93, indicating good reliability and simulation accuracy. The results of parameter calibration are shown in Fig. 9.
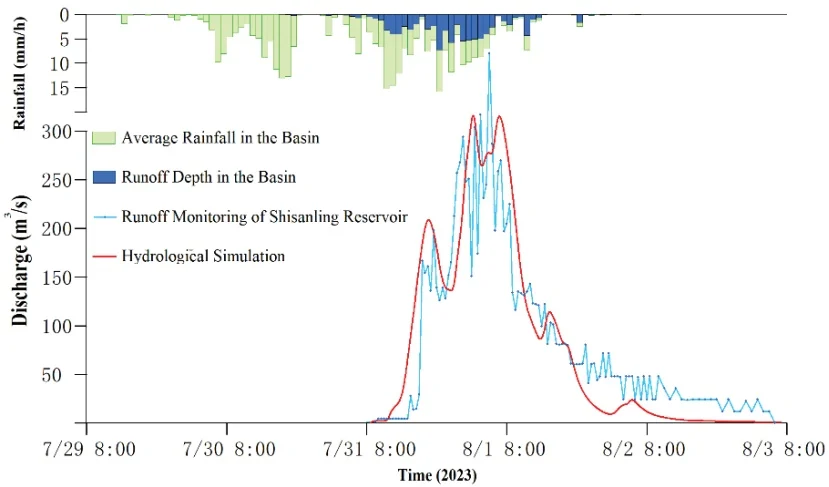
Fig. 9 Model parameter calibration results
4. Simulation Results
Fig. 10 shows the potential flash flood hazard areas in Shisanling Town under the scenario simulation of the "7·29" extreme rainfall in Liucun Town. Besides, the potential geological hazard areas based on the simulation results and historical geological disaster survey data are illustrated in Fig. 11. According to the simulation results, the area of water inundation in the Shisanling Town under this scenario reaches 6.2 km². All villages except for Yuling Village, 38 in total, will be affected by flooding. In particular, Beixin Village will be the most severely affected, with a flooded area of 1.6 km². The potential flood-affected area for each village is detailed in Table 3. The total number of affected residents is estimated to be 2,935, with the population number for each affected village provided in Table 2. The most heavily affected village is Jiantou Village, with 475 affected residents. It is estimated that 458 houses in the Shisanling Town are damaged, 3,593 mu (approximately 239.5 hectares) of orchards are inundated, and 1,581 mu (approximately 105.4 hectares) of farmland is destroyed.
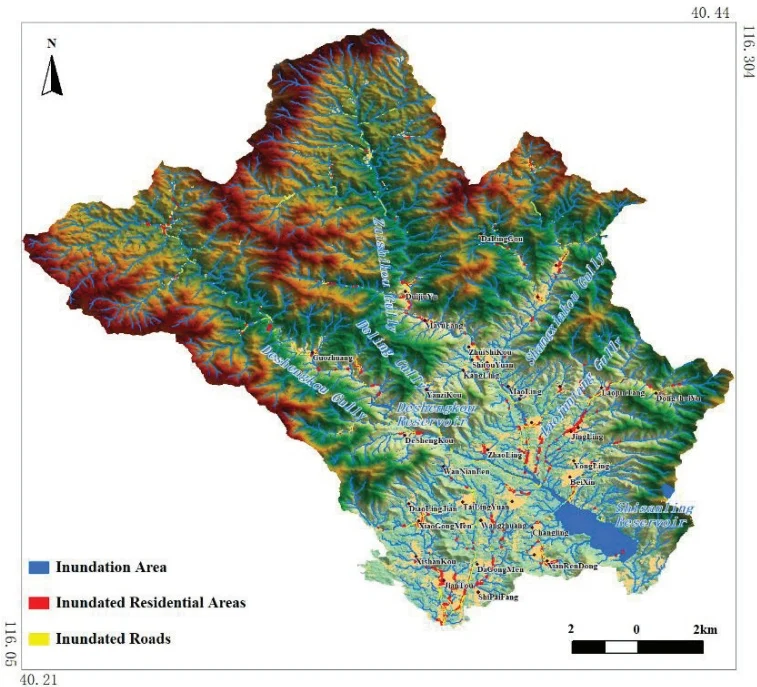
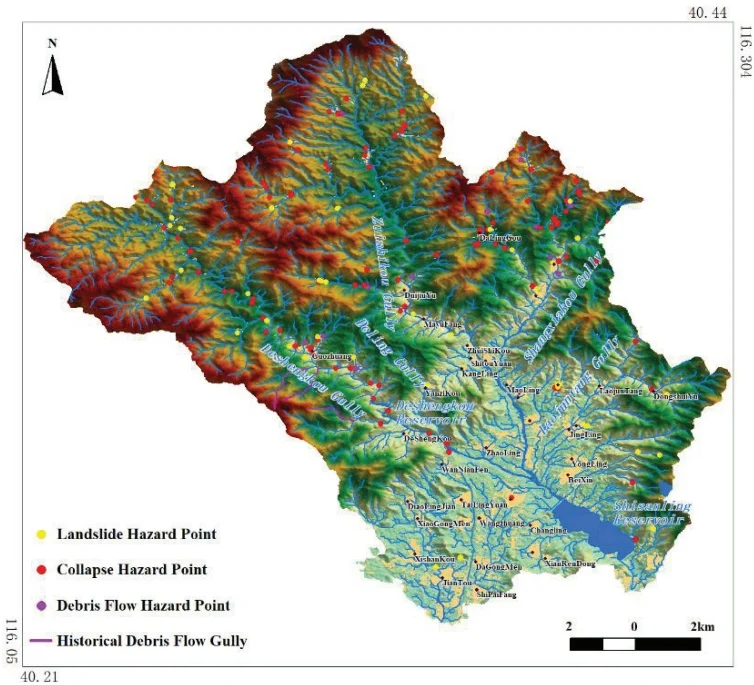
Fig. 11 Spatial Distribution of Geological Hazard Areas in the Shisanling Town
Table 2. Damage to Shisanling Town under the scenario of “7-29” extremely heavy rainfall in Liucun Town
| Town Name | Village name | Total Inundated Area() | Length of Roads (km) | Inundated | Number of affected people (persons) |
| Shisanling Town | Beixin | 1.630 | 3.2 | 95 | |
| Shisanling Town | Huzhuang | 0.011 | 0.1 | 20 | |
| Shisanling Town | Shipaifang | 0.006 | 0.0 | 5 | |
| Shisanling Town | Jiantou | 0.228 | 4.8 | 475 | |
| Shisanling Town | Dagongmen | 0.037 | 0.6 | 35 | |
| Shisanling Town | Xianrendong | 0.014 | 0.5 | 170 | |
| Shisanling Town | Nanxin | 1.333 | 0.7 | 75 | |
| Shisanling Town | Xishankou | 0.058 | 0.4 | 45 | |
| Shisanling Town | Changlingyuan | 0.059 | 0.7 | 45 | |
| Shisanling Town | Kanglingyuan | 0.062 | 0.8 | 25 | |
| Shisanling Town | Xiaogongmen | 0.106 | 2.4 | 250 | |
| Shisanling Town | Wangzhuang | 0.009 | 0.0 | 35 | |
| Shisanling Town | Tailingyuan | 0.031 | 0.8 | 20 | |
| Shisanling Town | Daolingjian | 0.017 | 0.1 | 5 | |
| Shisanling Town | Wanniangfen | 0.013 | 0.4 | 5 | |
| Shisanling Town | Deshengkou | 0.263 | 4.8 | 85 | |
| Shisanling Town | Guozhuang | 0.377 | 3.0 | 225 | |
| Shisanling Town | Jingling | 0.077 | 0.2 | 165 | |
| Shisanling Town | Deling | 0.054 | 0.6 | 30 | |
| Shisanling Town | Yongling | 0.051 | 1.8 | 25 | |
| Shisanling Town | Zhaoling | 0.205 | 4.0 | 65 | |
| Shisanling Town | Xianling | 0.173 | 1.1 | 100 | |
| Shisanling Town | Changling | 0.025 | 0.9 | 205 | |
| Shisanling Town | Dongshuiyu | 0.032 | 0.3 | 20 | |
| Shisanling Town | Qingling | 0.109 | 0.0 | 15 | |
| Shisanling Town | Yuling | 0.000 | 0.0 | 5 | |
| Shisanling Town | Laojuntang | 0.158 | 2.0 | 165 | |
| Shisanling Town | Huangquansi | 0.005 | 0.1 | 5 | |
| Shisanling Town | Maoling | 0.063 | 0.1 | 5 | |
| Shisanling Town | Yanzikou | 0.047 | 1.1 | 15 | |
| Shisanling Town | Kangling | 0.014 | 0.2 | 5 | |
| Shisanling Town | Tailing | 0.129 | 0.1 | 5 | |
| Shisanling Town | Shitouyuan | 0.087 | 2.8 | 25 | |
| Shisanling Town | Zhuishikou | 0.074 | 0.8 | 45 | |
| Shisanling Town | Mayufang | 0.070 | 0.3 | 135 | |
| Shisanling Town | Xiakou | 0.126 | 1.6 | 80 | |
| Shisanling Town | Shangkou | 0.159 | 3.2 | 100 | |
| Shisanling Town | Duijiuyu | 0.282 | 2.0 | 90 | |
| Shisanling Town | Dalinggou | 0.038 | 0.8 | 15 | |
| Aggregate | 6.232 | 47.3 | 2935 | ||
The Shisanling Reservoir is located on the Dongsha River, the northern branch of the Wenyu River, which is part of the North Canal water system. There are four upstream natural rivers flowing into this reservoir, i.e., Deshengkou Gully, Dui-shikou Gully, Shangxiakou Gully and Laojuntang Gully, covering a total upstream catchment area of . Construction of the Shisanling Reservoir began on January 21, 1958 and was completed on June 30 of the same year. In April 2003, a dam reinforcement and safety upgrade project was carried out. The dam of this reservoir is located between Mangshan Mountain and Hanbao Mountain, which is an earth dam with a clay core wall, with a length of 627 meters and a maximum height of 29 meters. The crest of the dam is 7.5 meters wide, at an elevation of 103 meters, and the wave protection wall reaches an elevation of 104 meters. The Shisanling Reservoir is a multi-year regulated, comprehensive water conservancy facility, serving both flood control and water supply needs for the Shisanling Hydropower Plant. It is designed to withstand a 1-in-100-year flood, with a design flood level of 98.54 meters. The check flood level for a 1-in-1000-year event is 102.12 meters. This reservoir has a total storage capacity of 74.5 million m. The inflow and dispatch rules of this reservoir are illustrated in Fig. 12.
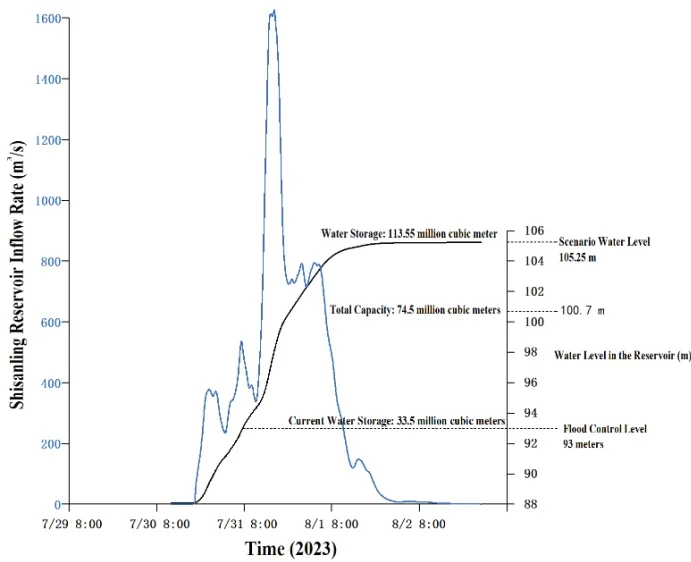
Fig. 12 The inflow and dispatch rules of Shisanling reservoir (Scenario levels indicate the corresponding storage levels in the reservoir under the assumption of no reservoir release scenario.)
The flood peak within the watershed of the Shisanling Reservoir occurs 48 hours after the onset of rainfall (simulated on the 29th) according to the scenario simulation results under the "7·29" extreme rainfall event in Liucun Town. At that time, the peak inflow of the Shisanling Reservoir reaches , and the maximum water depth in the river channel is 7.2 meters, occurring at the tail end of the reservoir near Nanxin Village. Once the flood level exceeds the 93-meter flood control limit, the Shisanling Reservoir needs to release a total of 80.05 million m3 of water. Based on the "7·29" extreme rainfall process and an outflow discharge rate of , it would take approximately 31 days to fully discharge the floodwater. If all the 80.05 million m3 of water were released downstream without regulation, the estimated inundated area would be approximately , affecting nine towns or subdistricts, i.e., Baishan Town, Cuicun Town, Nanshao Town, Xiaotangshan Town, Xingshou Town, Machikou Town, Shahe Town, Chengnan Subdistrict and Chengbei Subdistrict. The average water depth in the inundated areas would be about 0.37 meters, with the deepest flooding occurring in the lower-lying areas of Xiaotangshan and Baishan Towns. The spatial extent of the inundation is shown in Fig 13.
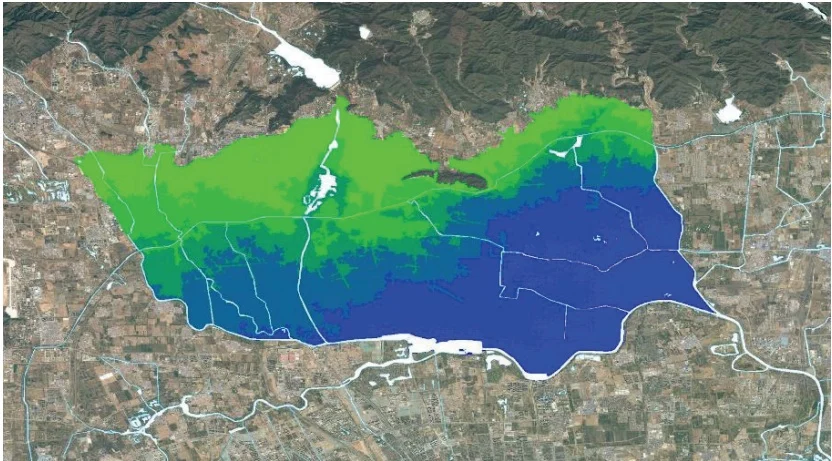
The maximum inundation depth in the northern area along the Wenyu River is estimated to be approximately 0.5 to 0.6 meters after the river discharge is taken into account, and the inundated area is shown in Fig 14. The inundated area involves a population of about 650,000 people and approximately 76,000 houses. Around 100 roads would be cut off due to the flooding, with a total affected length of approximately 750 km (Table 3). About 350,000 mu (roughly 23,300 hectares) of farmland would be flooded, including 330,000 mu of orchards, 17,000 mu of vegetable fields, and 3,000 mu of grain fields. Approximately 3.7 km² of parks would be submerged, involving 10 parks in total (Table 4). The inundated area also involves 6 universities and 10 secondary schools (Table 5).
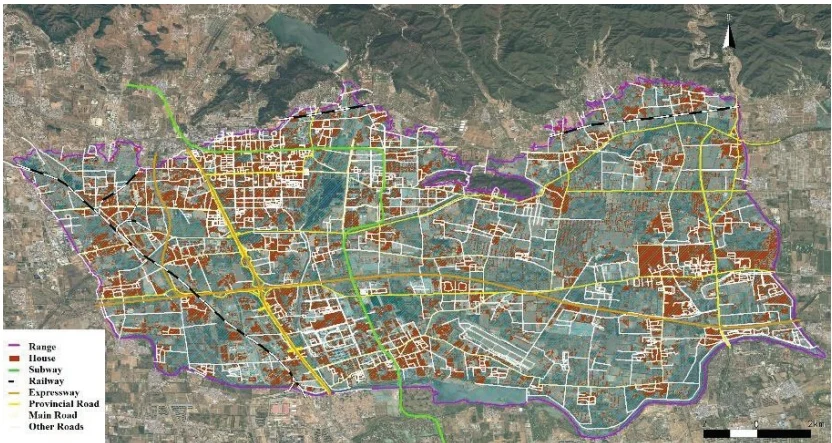
Fig. 14 Estimated inundation impacts of total flood releases from the Shisanling Reservoir
5. Conclusions and recommendations
5.1 Main Conclusions
The simulation results under the scenario of the "7·29" extreme rainfall in Liucun Town showed that the flood inundation area in Shisanling Town will reach 6.2 km², with Beixin Village being the most heavily inundated, covering an area of 1.6 km². The affected population is estimated at around 2,935 people, with Jiantou Village having the largest number of affected residents, totaling 475. The flood peak is expected to reach the tail end of the Shisanling Reservoir, located in Nanxin Village, after 48 hours since the onset of rainfall. The hilly areas at elevations between 200–500 meters encompass nearly all landslide, collapse, and debris flow sites identified in geological hazard investigations according to Beijing's geological hazard and geomorphological zoning standards under this scenario. In an extreme rainfall event (beyond a 1-in-1,000-year scenario), areas at higher elevations are prone to geological hazards, while areas at lower elevations are vulnerable to road and residential flooding. The entire watershed of the Shisanling Reservoir is highly susceptible to flash floods, with Guozhuang Village being the most prone to geological disasters. It is estimated that 458 houses would be flooded in the Shisanling Town, with 3,593 mu (about 240 hectares) of orchards inundated and 1,581 mu (about 105 hectares) of farmland damaged.
Once the water level of the Shisanling Reservoir exceeds the flood limit of 93 meters, a total flood discharge of 80.05 million m3 would be required. If this entire volume is released downstream without regulation, the estimated inundated area downstream would reach 218 km², affecting nine towns (or subdistricts), i.e., Baishan Town, Cuicun Town, Nanshao Town, Xiaotangshan Town, Xingshou Town, Chengnan Subdistrict, Chengbei Subdistrict, Machikou Town and Shahe Town. The average water depth in the inundated area is estimated to be 0.37 meters, with the greatest depths occurring in the lower-lying Xiaotangshan and Baishan towns, where the maximum inundation depth is estimated at 0.5-0.6 meters. The flooded area would affect approximately 650,000 people and about 76,000 houses. The flood would result in about 100 roads being cut off, with a total affected length of approximately 750 km. Around 350,000 mu (about 23,300 hectares) of farmland would be inundated, and the flooded zone would also involve 10 parks, 6 universities and 10 secondary schools.
Table 3. Estimated flooded roads downstream of Shisanling Town under simulation scenarios
| Flooded Road | Length (km) | Flooded Road | Length (km) | Flooded Road | Length (km) | Flooded Road | Length (km) |
| Shunsha Road | 28.6 | Chaoxin Road | 5.1 | South Ring North Road | 2.6 | Shuangheng Road | 1.6 |
| Qinshang Road | 22.1 | Beishahe Middle Road | 5.0 | Dongxin Road | 2.6 | Changcui North Road | 1.5 |
| Huaichang Road | 18.8 | Yong'an Road | 4.7 | North 3rd Road, Higher Education Park | 2.5 | Songyuan Road | 1.5 |
| Changcui Road | 14.1 | Middle Street, Higher Education Park | 4.7 | Machikou Village Road | 2.4 | Xiangbeiyu Road | 1.5 |
| Ansi Road | 13.9 | Kaichuang Road | 4.6 | Mayu Road | 2.4 | South Ring Bridge | 1.5 |
| G110 Auxiliary Line | 13.7 | Aniu Road | 4.6 | Chuangxin Road | 2.3 | Manjing Road | 1.5 |
| Nanfeng Road | 12.8 | Hongzhai Road | 4.5 | West West Road | 2.3 | Qincheng Road | 1.5 |
| Manbai Road | 11.5 | Inner Ring East Road | 4.3 | Government Street | 2.2 | Dongguan Road | 1.5 |
| Shuinan Road | 11.0 | Cui'a Road | 4.0 | Nanzhuang Road | 2.0 | Gulou North Street | 1.5 |
| Changjin Road | 10.9 | Ansi Road (Old) | 4.0 | Majiang Road | 1.9 | West Ring Road | 1.4 |
| Baisha Road | 10.5 | Chaoqian Road | 3.9 | Houxiao Road | 1.9 | Shangjiu Road | 1.4 |
| Nanbai Road | 9.1 | Fuxue Road | 3.8 | Maqin Road | 1.9 | Chaofeng South Road | 1.4 |
| South Ring Road | 9.0 | Baifuquan Road | 3.6 | Farm Road | 1.8 | Fukang Road | 1.4 |
| G6 Auxiliary Road | 9.0 | Changhou Road | 3.3 | Kangshan Road | 1.8 | Yuxinzhuang Road | 1.4 |
| Litang Road | 7.5 | Mianxin Road | 3.3 | East Ring Road | 1.7 | Xiangfang Road | 1.4 |
| South Ring East Road | 6.2 | X032 | 3.1 | Songxin Road | 1.7 | Tingbei Road | 1.3 |
| Changliu Road | 5.5 | Changcui Road (Old) | 3.0 | Longshui Road | 2.9 | Yanping Road | 1.3 |
| Inner Ring West Road | 5.4 | Changsheng Road | 2.8 | Reservoir Road | 1.7 | Loutu Road | 1.3 |
| Gulou South Street | 5.2 | Jiliu Road | 2.6 | South Haozhuang Road | 1.6 | Lixiang Road | 1.2 |
| Zhenxing Road | 5.2 | Xingxiang Road | 1.6 | Shuangheng Road | 1.6 | Lizhuang Road | 1.2 |
| Xiangtang Ring Road | 1.2 | 110 Auxiliary Line | 1.1 | Yuxinzhuang Road | 1.1 | Torch Street | 1.0 |
| Nanying Road | 1.2 | Xiaonong Road | 1.1 | Chaofeng North Road | 1.1 | Other sections <1km | 360.1 |
| Mengliang Road | 1.1 | Mabai Road | 1.1 | Government Street West | 1.0 | Total | 750.0 |
| Chaofeng Road | 1.1 | Shatun Road | 1.1 | Guanchang Road | 1.0 |
Table 4. Estimated flooded parks downstream of Shisanling Town under simulation scenarios
| Serial Number | Flooded Park | Flooded Area (km2) |
| 1 | Xincheng Riverside Forest Park | 2.09 |
| 2 | Xincheng Riverside Park | 0.54 |
| 3 | China Aviation Museum | 0.53 |
| 4 | Changping Park | 0.11 |
| 5 | Xuefu Park | 0.09 |
| 6 | Jiuhua Resort Amusement Park | 0.09 |
| 7 | Population Culture Park | 0.08 |
| 8 | Yong'an Park | 0.07 |
| 9 | Langqiao River Valley Park | 0.05 |
| 10 | Changping District Racecourse Park | 0.05 |
| Total | 3.70 | |
Table 5. Estimated Flooded Schools Downstream of Shisanling Town under simulation scenarios
| Serial Number | Flooded Park | Flooded Area (km2) |
| Universities | 1 | China University of Petroleum, Beijing Campus |
| 2 | China University of Political Science and Law, Changping Campus | |
| 3 | Beihang University, Changping Campus | |
| 4 | Beijing University of Chemical Technology, North Campus | |
| 5 | Central University of Finance and Economics, Shahe Campus | |
| 6 | Beijing Open University, Changping Branch | |
| High Schools | 1 | Beijing Changping District No. 2 High School |
| 2 | Beijing Changping District No. 4 High School | |
| 3 | Beijing Changping District No. 5 High School | |
| 4 | Beijing Changping District No. 6 High School | |
| 5 | Beijing Changping District Machikou High School | |
| 6 | Beijing Changping District Cuicun High School | |
| 7 | Beijing Changping District Xiaotangshan High School | |
| 8 | Affiliated High School of China University of Petroleum | |
| 9 | Changping Experimental High School | |
| 10 | Changping District Nanshao High School |
5.2 Disaster Prevention Recommendations
(1) The Shisanling Reservoir is estimated to experience extremely severe flooding under the simulation scenario, with inflow volumes exceeding the total storage capacity. This poses a substantial risk of dam overtopping or failure. Meanwhile excessive discharge may lead to extensive and prolonged inundation in downstream areas. It is therefore imperative that relevant authorities formulate scientifically sound reservoir operation and scheduling plans tailored to extreme conditions, enabling timely pre-release of storage capacity to attenuate flood peaks.
(2) Under the scenario of the “7·29” extreme rainfall in Liucun Town, it is essential that residents located in a hilly terrain zone at elevations between 200 and 500 meters in Shisanling Town should be fully evacuated during the early stages of rainfall. Coordinated efforts from multiple stakeholders should be organized to ensure effective evacuation and resettlement.
(3) There is a pressing need to adopt a proactive approach by advancing the point of intervention and establishing an effective early warning system for flood and waterlogging disasters. The integration of advanced, intelligent technologies is crucial for addressing the existing deficiencies in the early assessment of risks and in the accuracy and timeliness of warnings issued during population evacuation processes.
(4) Emergency response plans should incorporate detailed and adaptable evacuation strategies, including clearly designated emergency shelters and evacuation routes. A combination of communication channels should be employed to disseminate timely warnings and evacuation orders, ensuring that all residents in high-risk areas are evacuated without delay.
Author Contribution
Conceptualization, M.X., S.Q. and B.L.; methodology, M.X., B.L., and S.Q.; software, M.X., X.F. and R.L.; validation, M.X., B.L. and X.F.; formal analysis, M.X., B.L. and S.Q.; investigation, M.X., B.L. and R.L.; resources, S.Q. and M.X.; data curation, M.X.; writing—original draft preparation, M.X.; writing—review and editing, M.X. and S.Q.; visualization, , M.X., B.L. and X.F.; supervision, S.Q.; project administration, S.Q. and M.X.; funding acquisition, S.Q. and R.L. All authors have read and agreed to the published version of the manuscript.
Acknowledgements
This research was funded by the Project of Research on Quantitative Assessment and Monitoring and Early Warning Technology for Flood Disaster Risks under the National Key Research and Development Program (Sub-project Number: 2021YFB3901203-2). The authors would like to express their heartfelt gratitude to Changping District Emergency Management Bureau, Beijing for providing some of the basic information and data.
Conflict of Interests
The authors declare no conflicts of interest.
Data Availability
The data used in this paper belong to the National Institute of Natural Hazards, Ministry of Emergency Management of China.
References
Abbass, K., Qasim, M.Z., Song, H.M., et al., 2022, A review of the global climate change impacts, adaptation, and sustainable mitigation measures: Environmental Science and Pollution Research, v. 29, no. 28, p. 42539–42559, https://doi.org/10.1007/s11356-022-19718-6. Back to citation
Ambrose, R.B., Jr. and Wool, T.A., 1993, The Dynamic Estuary Model Hydrodynamics Program, DYNHYD5 Model Documentation and User Manual: U.S. Environmental Protection Agency Report, Environmental Research Laboratory, Athens, GA. 1 2
Ban, J., Lu, K., Liu, Y., Zang, J., Zhou, Z., Zhang, C., Liu, Z., Huang, J., Chen, Y., Gao, X., Xu, Y., Wang, C., Cai, W., Gong, P., Luo, Y., and Li, T., 2024, Projecting future excess deaths associated with extreme rainfall events in China under changing climate: an integrated modelling study: The Lancet Planetary Health, v. 8, no. 10, p. e723–e733, https://doi.org/10.1016/S2542-5196(24)00202-X. 1 2
Bellos, V., Papageorgaki, I., Kourtis, I., Vangelis, H., Kalogiros, I., and Tsakiris, G., 2020, Reconstruction of a flash flood event using a 2D hydrodynamic model under spatial and temporal variability of storm: Natural Hazards, v. 101, no. 3, p. 711–726, https://doi.org/10.1007/s11069-020-03891-3. Back to citation
Botzen, W.J.W., Deschenes, O., and Sanders, M., 2019, The economic impacts of natural disasters: A review of models and empirical studies: Review of Environmental Economics and Policy, v. 13, no. 2, p. 167–188, https://doi.org/10.1093/reep/rez004. Back to citation
Bryan, B.A., Gao, L., Ye, Y., Sun, X., Connor, J.D., Crossman, N.D., Stafford-Smith, M., and Wu, J., 2018, China’s response to a national land-system sustainability emergency: Nature, v. 559, no. 7713, p. 193–204, https://doi.org/10.1038/s41586-018-0280-2. Back to citation
Cea, L., Álvarez, M., and Puertas, J., 2022, Estimation of flood-exposed population in data-scarce regions combining satellite imagery and high resolution hydrological-hydraulic modelling: a case study in the Licungo basin (Mozambique): Journal of Hydrology: Regional Studies, v. 44, 101247, https://doi.org/10.1016/j.ejrh.2022.101247. Back to citation
Chen, Y., Sun, J., Xu, J., et al., 2021, Analysis and thinking on the extremes of the 21 July 2012 torrential rain in Beijing (part I): observation and thinking: Meteorological Monthly, v. 38, no. 10, p. 1255–1266, https://doi.org/10.7519/j.issn.1000-0526.2012.10.012. (in Chinese) Back to citation
Davenport, F.V., Burke, M., and Diffenbaugh, N.S., 2021, Contribution of historical precipitation change to US flood damages: Proceedings of the National Academy of Sciences, v. 118, no. 4, e2017524118, https://doi.org/10.1073/pnas.2017524118. Back to citation
Devitt, L., Neal, J., Coxon, G., Savage, J., and Wagener, T., 2023, Flood hazard potential reveals global floodplain settlement patterns: Nature Communications, v. 14, no. 1, 2801, https://doi.org/10.1038/s41467-023-38297-9. Back to citation
Doan, Q.V., Chen, F., Kusaka, H., Dipankar, A., Khan, A., Hamdi, R., Roth, M., and Niyogi, D., 2022, Increased risk of extreme rainfall over an urban agglomeration with future global warming: Earth's Future, v. 10, no. 6, e2021EF002563, https://doi.org/10.1029/2021EF002563. Back to citation
Du, R., Yao, C., Liu, Y., et al., 2022, Grid-Xin'anjiang model based on spatio-temporal dynamic combination of saturation-excess and infiltration-excess runoff: Journal of Hohai University (Natural Sciences), v. 50, no. 6, p. 25–32, https://doi.org/10.3876/j.issn.1000-1980.2022.06.004. (in Chinese) Back to citation
Eckardt, N.A., Ainsworth, E.A., Bahuguna, R.N., Broadley, M.R., Busch, W., Carpita, N.C., Castrillo, G., Chory, J., DeHaan, L.R., Duarte, C.M., Henry, A., Jagadish, S.V.K., Langdale, J.A., Leakey, A.D.B., Liao, J.C., Lu, K.-J., McCann, M.C., McKay, J.K., Odeny, D.A., de Oliveira, E.J., Platten, J.D., Rabbi, I., Rim, E.Y., Ronald, P.C., Salt, D.E., Shigenaga, A.M., Wang, E., Wolfe, M., and Zhang, X., 2023, Climate change challenges, plant science solutions: The Plant Cell, v. 35, no. 1, p. 24–66, https://doi.org/10.1093/plcell/koac303. Back to citation
Fang, J., Li, M., and Shi, P., 2015, Mapping Flood Risk of the World, In: Shi, P. and Kasperson, R. (eds.), World Atlas of Natural Disaster Risk, Springer, Berlin, Germany, p. 69–102. Back to citation
Fu, J., Ma, X., Chen, T., et al., 2017, Characteristics and synoptic mechanism of the July 2016 extreme rainfall event in north China: Meteorological Monthly, v. 43, no. 5, p. 528–539, https://doi.org/10.7519/j.issn.1000-0526.2017.05.002. (in Chinese) Back to citation
Guo, Y., Huang, S., Huang, Q., Wang, H., Wang, L., and Fang, W., 2019, Copulas-based bivariate socioeconomic drought dynamic risk assessment in a changing environment: Journal of Hydrology, v. 575, p. 1052–1064, https://doi.org/10.1016/j.jhydrol.2019.06.010. 1 2
Hao, S., Wang, W., Ma, Q., et al., 2023, A numerical rehearsal strategy of flash flood disaster with hydrological and hydrodynamic modelling: case study of “7·20” flash flood disaster in Wangzongdian Village, Henan Province: Water Resources and Hydropower Engineering, v. 54, no. 6, p. 1–11, https://doi.org/10.13928/j.cnki.wrahe.2023.06.001. (in Chinese) Back to citation
He, Y., Zhang, K., Chao, L., et al., 2023, Watershed runoff simulation based on multi-source remotely sensed soil moisture and data assimilation: Water Resources Protection, v. 39, no. 2, p. 145–151, https://doi.org/10.3880/j.issn.1004-6933.2023.02.018. (in Chinese) Back to citation
Huang, P., Li, Z., Yao, C., et al., 2013, Application and comparison of hydrological models for semi-arid and semi-humid regions: Journal of Hydroelectric Engineering, v. 32, no. 4, p. 4–9, https://www.paper.edu.cn/releasepaper/content/201203-262. (in Chinese) Back to citation
Ibarrarán, M.E., Malone, E.L., and Brenkert, A.L., 2010, Climate change vulnerability and resilience: Current status and trends for Mexico: Environment, Development and Sustainability, v. 12, no. 3, p. 365–388, https://doi.org/10.1007/s10668-009-9201-8. Back to citation
Li, B., Lu, K., Liu, Y., Zang, J., Zhou, Z., Zhang, C., Liu, Z., Huang, J., Chen, Y., Gao, X., Xu, Y., Wang, C., Cai, W., Gong, P., Luo, Y., and Li, T., 2024, Projecting future excess deaths associated with extreme rainfall events in China under changing climate: an integrated modelling study: The Lancet Planetary Health, v. 8, no. 10, p. e723–e733, https://doi.org/10.1016/S2542-5196(24)00202-X. Back to citation
Li, X., Zhang, Y., Li, W., Chen, Y., Zeng, H., Jiang, Y., Gao, H., Zhai, J., Mei, M., and Sun, L., 2023, Extreme characteristics of “23·7” heavy rain in Beijing-Tianjin-Hebei and its implications for urban flood control in China: China Flood and Drought Management, v. 33, no. 11, p. 13–18, https://doi.org/10.16867/j.issn.1673-9264.2023381. (in Chinese) Back to citation
Li, Z., Huang, P., Zhang, J., et al., 2025, Construction and application of Xin'anjiang-Haihe model: Journal of Hohai University (Natural Sciences), v. 53, no. 1, p. 189–195, https://doi.org/10.3876/j.issn.1000-1980.2025.01.001. (in Chinese) Back to citation
Li, Z., Yao, C., Zhang, K., et al., 2017, Research and application of the high-resolution rainfall runoff hydrological model in flood forecasting: Journal of Hohai University (Natural Sciences), v. 45, no. 6, p. 471–480, https://doi.org/10.3876/j.issn.1000-1980.2017.06.001. (in Chinese) Back to citation
Liu, F., Ouyang, Y., Wang, B., Yang, J., Ling, J., and Hsu, P.-C., 2020, Seasonal Evolution of the Intraseasonal Variability of China Summer Rainfall: Climate Dynamics, v. 54, p. 4641–4655, https://doi.org/10.1007/s00382-020-05251-0. Back to citation
Liu, J., Mei, C., Wang, J., Wang, D., and Wang, H., 2023, Flood survey of “23·7” heavy rain in Mentougou Watershed of Beijing: China Flood and Drought Management, v. 33, no. 9, p. 50–55, https://doi.org/10.16867/j.issn.1673-9264.2023332. (in Chinese) Back to citation
Liu, Y., Li, J., Chen, R., et al., 2024, Analyzing the flood disaster chain in Zhengzhou City based on complex network: Journal of Catastrophology, v. 39, no. 2, p. 227–234, https://doi.org/10.3969/j.issn.1000-811X.2024.02.033. (in Chinese) Back to citation
Luo, Y., Qin, H., Yao, C., et al., 2023, Confluence calculation method based on grid water drop: Journal of Hohai University (Natural Sciences), v. 51, no. 6, p. 9–17, https://doi.org/10.3876/j.issn.1000-1980.2023.06.002. (in Chinese) Back to citation
Ma, J., Gao, H., Xu, C., and Qi, S., 2025, Characterization and formation mechanism of the catastrophic flash flood-debris flow hazard triggered by the July 2023 extreme rainstorm in Hantai Gully of Beijing, China: Landslides, v. 22, p. 877–893, https://doi.org/10.1007/s10346-024-02433-3. Back to citation
Miller, J.D., Kim, H., Kjeldsen, T.R., Packman, J., Grebby, S., and Dearden, R., 2014, Assessing the impact of urbanization on storm runoff in a peri-urban catchment using historical change in impervious cover: Journal of Hydrology, v. 515, p. 59–70, https://doi.org/10.1016/j.jhydrol.2014.04.011. Back to citation
Mishra, S.K. and Singh, V.P., 2003, Soil Conservation Service Curve Number (SCS-CN) Methodology, Kluwer Academic Publishers, Dordrecht, Netherlands. Back to citation
Mishra, S.K. and Singh, V.P., 2004, Long-term hydrological simulation based on the soil conservation service curve number: Hydrological Processes, v. 18, no. 7, p. 1291–1313, https://doi.org/10.1002/hyp.1344. Back to citation
Ni, X., Huang, H., Dong, W., Chen, C., and Chen, A., 2021, Scenario prediction and crisis management for rain-induced waterlogging based on high-precision simulation, In: Proceedings of the 18th International Conference on Information Systems for Crisis Response and Management (ISCRAM2021), Blacksburg, VA, Virginia Tech. Back to citation
Ouyang, M., Kotsuki, S., Ito, Y., and Tokunaga, T., 2022, Employment of hydraulic model and social media data for flood hazard assessment in an urban city: Journal of Hydrology: Regional Studies, v. 44, 101261, https://doi.org/10.1016/j.ejrh.2022.101261. 1 2
Papalexiou, S.M. and Montanari, A., 2019, Global and regional increase of rainfall extremes under global warming: Water Resources Research, v. 55, no. 6, p. 4901–4914, https://doi.org/10.1029/2018WR024067. Back to citation
Patil, J.P., Sarangi, A., Singh, A.K., and Ahmad, T., 2008, Evaluation of modified CN methods for watershed runoff estimation using a GIS-based interface: Biosystems Engineering, v. 100, no. 1, p. 137–146, https://doi.org/10.1016/j.biosystemseng.2008.02.001. Back to citation
Peng, H., Liu, Y., Wang, H., and Ma, L., 2015, Assessment of the service performance of drainage system and transformation of pipeline network based on urban combined sewer system model: Environmental Science and Pollution Research, v. 22, no. 20, p. 15712–15721, https://doi.org/10.1007/s11356-015-4707-0. Back to citation
Peng, L., Xia, J., Li, Z., Fang, C., and Deng, X., 2020, Spatio-Temporal Dynamics of Water-Related Disaster Risk in the Yangtze River Economic Belt from 2000 to 2015: Resources, Conservation and Recycling, v. 161, 104851, https://doi.org/10.1016/j.resconrec.2020.104851. Back to citation
Ponce, V.M. and Hawkins, R.H., 1996, Runoff curve number: Has it reached maturity?: Journal of Hydrologic Engineering, v. 1, no. 1, p. 11–19, https://doi.org/10.1061/(ASCE)1084-0699(1996)1:1(11). Back to citation
Rentschler, J., Salhab, M., and Jafino, B.A., 2022, Flood exposure and poverty in 188 countries: Nature Communications, v. 13, 3527, https://doi.org/10.1038/s41467-022-30727-4. Back to citation
Shrestha, B.B., Kawasaki, A., and Zin, W.W., 2021, Development of flood damage assessment method for residential areas considering various house types for Bago region of Myanmar: International Journal of Disaster Risk Reduction, v. 66, 102602, https://doi.org/10.1016/j.ijdrr.2021.102602. Back to citation
Shu, X., Xu, Z., Ye, C., et al., 2023, Flooding/waterlogging process response analysis and road flooding simulation in urban area of Jincheng City: Water Resources Protection, v. 39, no. 4, p. 176–186, https://doi.org/10.3880/j.issn.1004-6933.2023.04.022. (in Chinese) Back to citation
Wang, Z., Yao, C., Dong, J., et al., 2022, Rainfall characteristic and urban flooding influence of “7·20” extreme rainstorm in Zhengzhou: Journal of Hohai University (Natural Sciences), v. 50, no. 3, p. 17–22, https://doi.org/10.3880/j.issn.1004-6933.2024.01.002. (in Chinese) Back to citation
Wu, J., Han, G., Zhou, H., and Li, N., 2018, Economic Development and Declining Vulnerability to Climate-Related Disasters in China: Environmental Research Letters, v. 13, no. 3, 034013, https://doi.org/10.1088/1748-9326/aaabd7. Back to citation
Wu, Y., Li, Z., Qi, Z., et al., 2023, Design flood calculation of watershed with lack of data based on hydrological model: Journal of Hohai University (Natural Sciences), v. 51, no. 6, p. 1–8, https://doi.org/10.3876/j.issn.1000-1980.2023.06.001. (in Chinese) Back to citation
Yu, S., Li, R., Zhang, Y., Wang, M., Zhang, P., Wu, A., Yu, F., Zhang, X., Yang, L., and Cui, Y., 2023, A research on urban disaster resilience assessment system for rainstorm and flood disasters, A case study of Beijing: PLoS One, v. 18, no. 10, e0291674, https://doi.org/10.1371/journal.pone.0291674. Back to citation
Zhang, J., Shu, Z., Wang, H., et al., 2023, A discussion on several hydrological issues of “7·20” rainstorm and flood in Zhengzhou: Acta Geographica Sinica, v. 78, no. 7, p. 1618–1626, https://doi.org/10.11821/dlxb202307004. (in Chinese)
Zhang, Q., 2023, The cause and enlightenment of the “23·7” extremely rainstorm disaster in Fangshan District of Beijing City: China Flood and Drought Management, v. 33, no. 10, p. 43–47, https://doi.org/10.16867/j.issn.1673-9264.2023407. (in Chinese)
Zou, L., Xia, J., Zhang, Y., et al., 2021, Spatial-temporal change characteristics and driving forces of rainfall in the Haihe River Basin: Water Resources Protection, v. 37, no. 1, p. 53–60, https://doi.org/10.3880/j.issn.1004-6933.2021.01.008. (in Chinese) 1 2