RESEARCH ARTICLE · OPEN ACCESS
Using the HySpex hyperspectral imaging system for mapping the alteration zones in the Yudai, Kalatage district, NW China
- 1State Key Laboratory of Desert and Oasis Ecology, Xinjiang Institute of Ecology and Geography, Chinese Academy of Sciences, Urumqi, Xinjiang 830011, China
- 2Xinjiang Key Laboratory of Mineral Resources and Digital Geology, Urumqi 830011, China
- 3Xinjiang Research Centre for Mineral Resources, Chinese Academy of Sciences, Urumqi 830011, China
- 4University of Chinese Academy of Sciences, Beijing 100049, China
- Received:
- Accepted:
- Published:
Abstract
The HySpex hyperspectral data used in this study have a wide spectral response range, narrow bandwidth, and high spatial resolution, and they can be effectively applied to the extraction of mineral alteration information. We explore how to extract effective information from remote sensing images through remote sensing image classification technology and explore its utilization in geological science. This study aims to verify the reliability and accuracy of alteration information extracted by using a super-low altitude detection platform equipped with powered delta wings mounted with HySpex hyperspectral sensors in the Yudai area of the Kalatage district. Field data were collected and analyzed using Analytical Spectral Devices (ASD), and the results were compared with those obtained from the United States Geological Survey (USGS) spectral library. The analysis of the geological background and HySpex hyperspectral data was enhanced by Minimum Noise Fraction (MNF) transformation coupled with the Pixel Purity Index (PPI) to extract endmembers of altered minerals, including chlorite and jarosite, from different spectra (SWIR and VNIR) and spectral wavelengths. Additionally, two classification methods, the Spectral Angle Mapper (SAM) and Support Vector Machine (SVM), were applied to the data for effective mineral mapping. The best-performing method, i.e., SVM, was validated using ground-truth information obtained during field observations. The results from the classification methods revealed accuracies of 59.57% for SAM and 69.25% for SVM. The HySpex hyperspectral data obtained using a super-low altitude detection platform proved highly effective for detecting altered rock information. Thus, this approach has great potential for the rapid identification of geological and mineralogical features, especially in complex terrains.
Keywords: Alteration extraction;field verification;endmember;reflection;delta wing;low-altitude
1. Introduction
In mineral exploration, many techniques have been applied to detect the presence of mineralization and related altered rocks (Mathieu, M. et al. 2017). Remote sensing technology offers a range of advantages, such as wide coverage, high efficiency, short cycle duration, and strong economic benefits, making it critically important for pathfinders (Vincent, R.K. et al. 1997). Among these advantages, the application of hyperspectral remote sensing is particularly crucial due to its advanced techniques and methods for mineral exploration and mapping. Additionally, hyperspectral technology exhibits significant diagnostic spectral features across the electromagnetic spectrum, enabling the detection of chemical composition and relative abundance of minerals and deposits within rocks or geological formations (Mathieu, M. et al. 2017, Filho, A.P.C.S.A.C.R.D.S. et al. 2000, Salehi, S et al. 2017).
Our study focuses on the use of HySpex hyperspectral data for mineral mapping in the Yudai area of the Kalatage district, which has significant potential for hosting diverse mineral types. Previous researchers (Koerting, et al. 2017; Denk, M et al. 2015; Baissa, R et al. 2011) have utilized HySpex hyperspectral remote sensing for mineral mapping and validated their results through laboratory analyses and fieldwork (Mathieu, M. et al. 2017; Koerting, et al. 2017; Denk, M et al. 2015; Baissa, R et al. 2011). This approach provides reliable image-based information through narrow, continuous spectral band estimations of Earth’s surface materials. In geological exploration, spectral absorption characteristics are used to infer mineralogical composition, lithology, and quantitative assessments of chemical or physical rock properties, all of which can be derived from HySpex hyperspectral images (Baissa, R et al. 2011).
The Yudai copper deposit, located in the western part of the Kalatage district, is hosted by porphyritic quartz diorite (Chen, L et al.2017; Molan, Y.E.et al. 2014). HySpex hyperspectral data have been widely used by researchers to study porphyry-type deposits. For example, Barger et al. 2003 employed hyperspectral data to map mineral alteration associated with concealed porphyry copper deposits in the northern Patagonia Mountains of Arizona. According to Kokaly et al. 2017, HySpex hyperspectral imaging is particularly suitable for identifying porphyry copper-related alteration and mineralized rocks. The large spatial extent of alteration systems has also made porphyry copper deposits a key target for spaceborne hyperspectral remote sensing applications (Bedini, E.2017).
Results from previous studies confirm the presence of alteration mineral outcrops in various regions globally, including our study area (Erickson, R.L.1982). Among these outcrops, this study focuses on selected altered minerals such as chlorite and jarosite, which are associated with porphyry copper deposits, to enable more effective evaluation using hyperspectral techniques and classification methods (Murphy, R.J et al. 2012).
In this study, we employed an ultra-low altitude detection platform equipped with HySpex cameras, which provide sub-meter-level spatial resolution (Adão, T et al. 2017). The system integrates a visible-nearinfrared (VNIR) sensor and a short-wave infrared (SWIR) sensor. Field-collected data were preprocessed, and subsequent processing included Minimum Noise Fraction (MNF) transformation to reduce noise, minimize computational demands, and address the inherent dimensionality of the image data (Boardman, J.et al, 1994). This process facilitates the grouping of pixels into distinct classes within hyperspectral images (Chehdi, K et al.2014). The selected classes were compared with Analytical Spectral Devices (ASD) spectra and the United States Geological Survey (USGS) spectral library, after which they were exported as Region of Interest (ROI) files for classification (Boardman, J.et al.1994; Chehdi, K.et al.2014; Boardman, J.W.et al.1993). Finally, two classification methods—Spectral Angle Mapper (SAM) and Support Vector Machine (SVM)—were tested and validated using ground-truth data obtained during field observations (Bishop, C.A.et al.2011;). The most accurate results were applied to classify images, enabling the identification of pixels representing altered minerals (Murphy, R.J.et al.2017). The selection of an appropriate classification algorithm is paramount for accurately translating spectral information into a mineral map. In this context, the Support Vector Machine (SVM) classifier offers distinct advantages for processing hyperspectral data like that from HySpex. SVM is particularly effective in high-dimensional feature spaces, which are inherent to hyperspectral datasets with their hundreds of contiguous spectral bands. It operates by finding the optimal hyperplane that maximizes the margin between different mineral classes, making it robust to overfitting and capable of handling complex, non-linear relationships even when the number of training samples is limited. This resilience to the "curse of dimensionality" and its ability to generalize well from small, field-validated training data make SVM a powerful and suitable choice for discriminating between the subtle spectral signatures of alteration minerals such as chlorite and jarosite.
2. Geology of the Yudai Deposits and Sampling
2.1. Geology of the study area
The Eastern Tianshan is situated south of the Junggar Basin and occupies the middle part of the Southern Tianshan Suture Belt within the southern Central Asian Orogenic Belt (Fig.1a). It covers an area of around 60,000 km² in the northeastern part of Xinjiang Province, China (Xiao, W.-J.et al.2004; Xiao, W.et al.2010). The Kalatage area is juxtaposed with the Tufan region to the west and the Harlik-Dananhu Arc to the east (Fig.1b) (Mao, Q.2014).
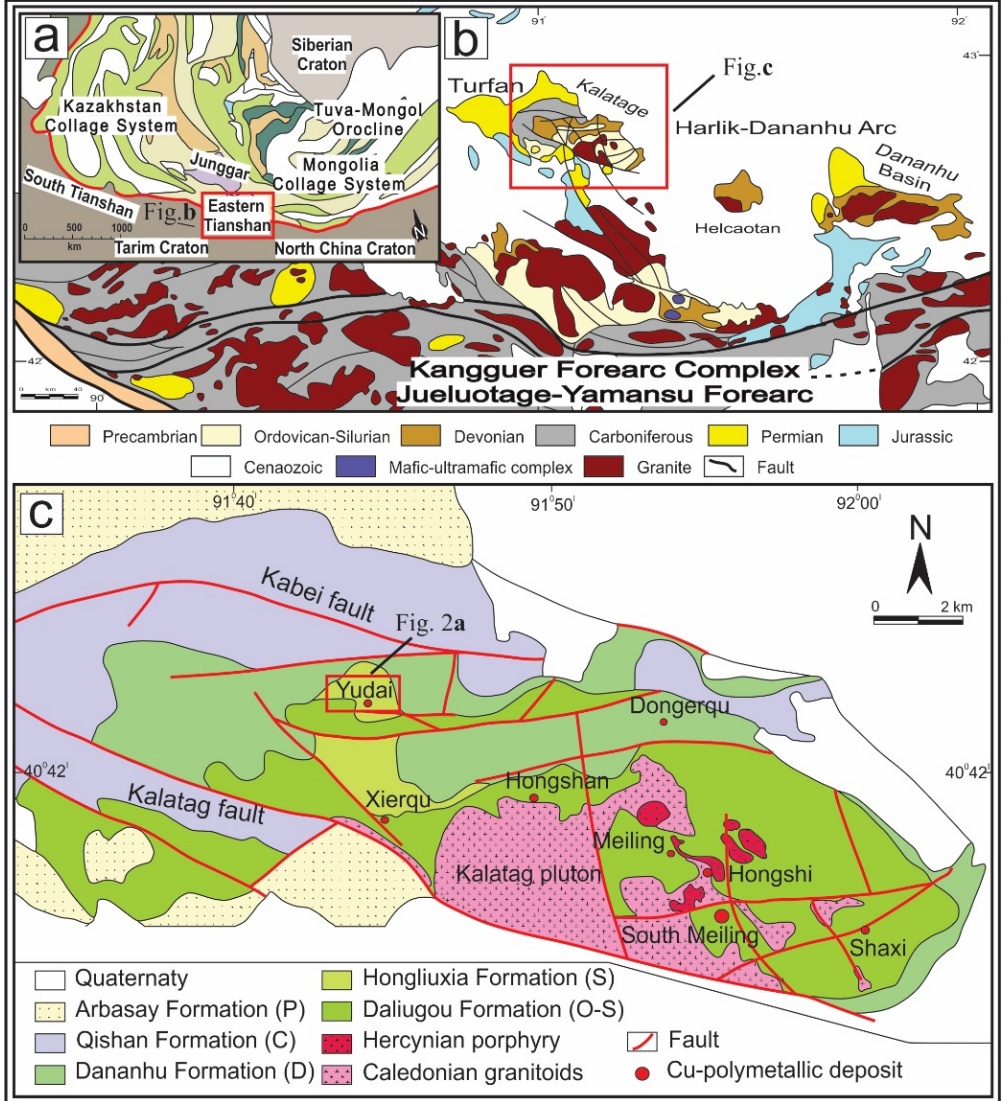
Fig. 1 (a) Schematic tectonic map of Central Asia and adjacent regions, highlighting the Eastern Tianshan (modified after XBGMR, 1993; Xiao et al., 2004) (b) Schematic geological map of the Eastern Tianshan (Modified after Xiao et al., 2004a). (c) Regional geological map of the Kalatage area (after Deng et.al. 2016a)
It comprises the Ordovician-Silurian Daliugou, Silurian Hongliuxia, Devonian Dananhu, Carboniferous Qishan, and Permian Arbasay formation (Fig.1c). The Ordovician-Silurian Daliugou Formation consists of basaltic andesite and tuff at the base, overlain by dacitic lava at the top. Mineralization predominantly occurs at the contact zones between the tuff and either dacite or volcanic breccia. The Hongliuxia Formation includes sandstone and siltstone at the base, succeeded by calcareous siltstone, fine-grained sandstone, and limestone. The Dananhu Formation unconformably overlies the Hongliuxia Formation and is composed of pyroclastics, limestone, and mafic-intermediate volcanic rocks. The Qishan Formation comprises mafic rocks, felsic pyroclastic rocks, and lava. The Arbasay Formation consists of sandstone, diamictites, and mafic to felsic volcanic and pyroclastic rocks. The intrusive rocks in the study area are composed of Caledonian granitoids and Hercynian porphyry, which are located in the southeastern part of the Kalatage area (Deng, X.- H.2016; Deng, X.-H.et al.2018; Deng, X.H.et al.2018).
The Yudai copper deposits are situated in the western part of the Kalatage area, south of the Kabei Fault (Fig. 2a). The deposits primarily consist of intrusive, volcanic (effusive), and sedimentary rocks. The mineralization is hosted within porphyritic quartz diorite, which intrudes into Ordovician andesite of the Daliugou Formation. Volcanic rocks, intrusive rocks, mineralization zones, and alteration zones are faultcontrolled and predominantly occur in the eastern, northwestern, and northern parts of the region (Chen, L.et al 2017). Various intrusive rocks, including rhyolite porphyry, porphyritic quartz diorite, and gabbro, form stocks and dike intrusions in the western part of the area, covering approximately 5 km². These intrusions are spatially and temporally associated with mineralization. The Yudai district’s mineralization exhibits lenticular, vein-type, and disseminated textures within the porphyritic quartz diorite. The mineral assemblage comprises pyrite-chalcopyrite-magnesite (±chalcocitemolybdenite), with gangue minerals such as chlorite, quartz, and sericite, along with minor amounts of epidote and carbonate.
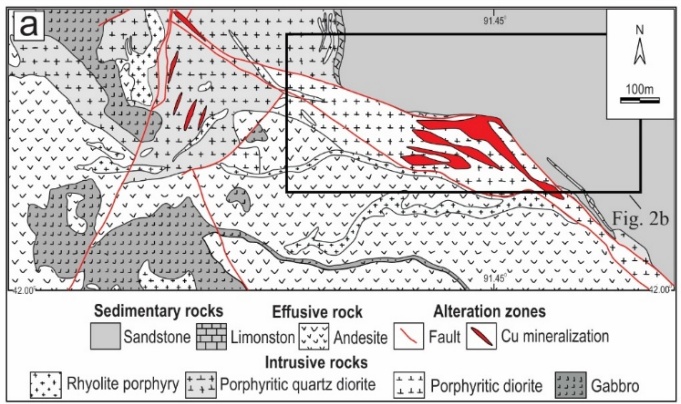
(a)
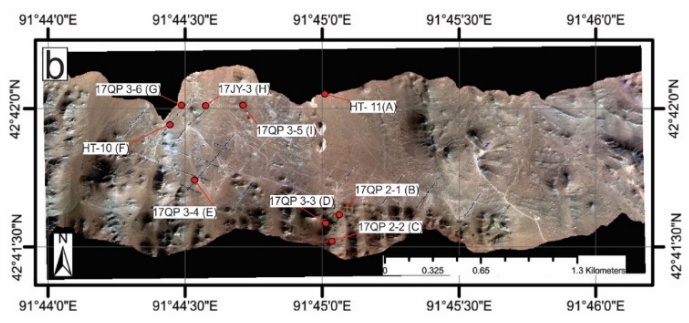
(b)
The hydrothermal alteration is characterized by potassic alteration (K-feldspar and biotite), silicification, chlorite, epidote, sericite, and carbonate, which can be identified using remote sensing methods. The study area’s landform comprises low hills, wide valleys, and quasi-plain terrain (Fig.2b). The general ground elevation ranges from 500–600 meters, with a maximum elevation of 693 meters and a relative relief of tens of meters. The area experiences a continental arid climate with extreme temperature differences between dry and wet seasons. There are no permanent rivers; water sources rely solely on atmospheric precipitation (rain and snow), which evaporates rapidly, resulting in sparse vegetation (Fricke, K.2018; Chen, D.et al.2018).
2.2. Sampling
Sample collection was performed through a comparative study, and higher-quality sample data were selected to extract alteration information for the study area (Bishop, C.A.et al.2011). Based on the alteration anomaly map, the workflow included the following steps: 1) Extraction of alteration information from remote sensing imagery. 2) Planning of fieldwork routes for sample collection. 3) Determination of specific sampling locations (Fig. 2b). Description of the collected samples are provided in Table 1.
3. Data Analysis
3.1. HySpex dataset
During data acquisition, a powered delta wing (Airborne XT91) equipped with an imaging spectrometer, POS (Position and Orientation System), and a control system was used to collect data during low-altitude flights over the study area (Fig. 3a). The powered delta wing is a self-powered, high-flying aircraft characterized by its lightweight, simple, and rugged design. For takeoff and landing, the required runway distance ranged from 50–150 meters, while operational parameters included an altitude range of 50–4,000 meters and a cruising speed of 45–110 km/h. The imaging spectrometer integrated into the delta wing is a push-broom-type linear array hyperspectral HySpex spectrometer, developed by the Norwegian company NEO (Norsk Elektro Optikk). The HySpex spectrometer features: ground and airborne versatility, minimal and identical point spread function (PSF) across the entire field of view and spectral range, optimal alignment of PSF and pixel size, low stray light, reduced smile effect and spectral keystone effect. The HySpex linear array CCDs include 216 bands in the visible-near-infrared (VNIR-1024) module (spectral range: 400–1000 nm, spectral resolution: 2.7 nm) and 288 bands in the shortwave infrared (SWIR-384i) module (spectral range: 950–2500 nm, spectral resolution: 5.4 nm) (Fig. 3b).
Key parameters of the spectrometers are summarized in Table 2.
Table 1. Sample description.
| No | Sample number | Latitude | Longitude | Lithological description |
| 1 | HT- 11 (A) | 42041'51" | 91045'20" | Invaded igneous rock package |
| 2 | 17QP2-1 (B) | 42041'35" | 91045'20" | Speckled feldspar, fine grain, basic rock, partially exposed surface chlorite |
| 3 | 17QP2-2 (C) | 42041'31" | 91045'19" | Brown, containing a lot offeldspars, basic rock |
| 4 | 17QP3-3 (D) | 42041'40" | 91044'12" | Chlorite |
| 5 | 17QP3-4 (E) | 42041'47" | 91044'34" | Limonite mineralization, covered with a small amount ofgravel, containing a small amount of jarosite |
| 6 | HT-10 (F) | 42042'19" | 91044'48" | Thejarosite is covered with shallow soil and the exposed red yellow potash |
| 7 | 17QP3-6 (G) | 42042'42" | 91045'70" | Limonite mineralization, surface red limonite mineralization. Bottom yellow potash, including potash feldspar, calcite |
| 8 | 17JY-3 (H) | 42042'11" | 91044'31" | Altered gabbro |
| 9 | 17QP3-5 (I) | 42070'09" | 91075'13" | Ground gravel |
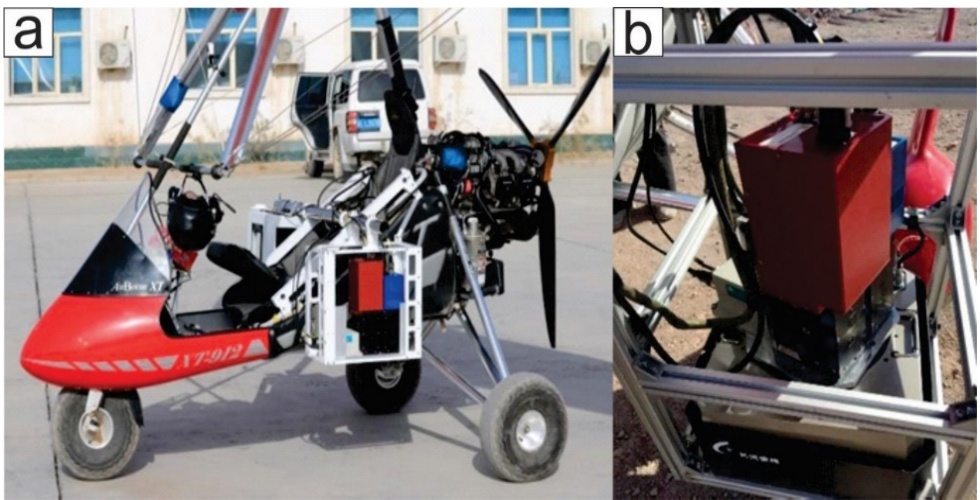
Fig. 3 HySpex hyperspectral platform: (a) delta wing (Airborne XT91) and (b) HySpex cameras.
The research team conducted fieldwork in the Kalatage area, designing a 5 km flight path for the delta wing. During flights, the aircraft must avoid exposure to air currents, which can cause momentary tilting and lead to hyperspectral image distortion. Fortunately, ideal weather conditions during the survey minimized air currents, reducing operational challenges. However, even minor turbulence or misalignment necessitated geometric correction of the data. To ensure seamless hyperspectral data stitching (avoiding gaps or quality degradation), the flight parameters included: 40% image overlap, flight altitude: 1,000 meters, spatial resolution: ~1 m. As per Equation 2.1, the scan width per flight route was 286.7 m, requiring a 400 m route spacing to meet overlap and altitude requirements. The raw hyperspectral data collected by the team consisted of digital number (DN) values without inherent physical meaning. These data lacked a coordinate system and exhibited geometric distortion and atmospheric interference, necessitating preprocessing steps:
1) Radiometric calibration (using HySpex RAD software to convert DN values to radiometric units),
2) Radiometric calibration (using HySpex RAD software to convert DN values to radiometric units),
3) Geometric correction (aligning spatial features),
4) Atmospheric correction (removing atmospheric effects).
Table 2. HySpex spectrometer parameters.
| Sensor name | VNIR-1024 | SWIR-384i |
| Imaging | Push sweep | Push sweep |
| Spectral sampling | 2.8 nm | 6.5 nm |
| Spectral range | 400 – 1000 nm | 950 – 2500 nm |
| Spectral bands | 216 | 288 |
| Spatial pixels | 1024 | 384 |
| Camera Size (cm) | 31.5*8.4*13.8 | 39.0*12.0*17.5 |
| Second-order suppression | Built-in | Built-in |
| Frame rate | 350fps | 450fps |
| Lateral field of IFOV | 16° | 16° |
| 0.28mrad/0.56mrad | 0.16mrad/0.32mrad | |
| Types of Digitizing | Si CCD, 2048 x 12 bit | HgCdTe, 384 x 288 16 bit |
| Power consumption | 6W | 36W |
Following basic format conversion, geometric calibration was performed using PARGE software (developed by the Remote Sensing Laboratory at the University of Zurich). Topographic correction was applied by integrating position and orientation data (POS) recorded by NovAtel’s SPAN-CPT instrument. Atmospheric correction was conducted using ATCOR software (Lenhard, K.et al.2014; Guo, J.et al.2014). Additionally, image registration was performed using the registration and mosaic tools in ENVI 5.1 Classic, while masking and other post-processing steps were carried out in ArcGIS and CorelDRAW. To extract endmember pixels from the HySpex hyperspectral data, the workflow involved: 1) Dimensionality reduction of the raw data to isolate key spectral features. 2) Noise reduction using the Minimum Noise Fraction (MNF) method. 3) Identification of pure spectral signatures via the Pixel Purity Index (PPI). 4)Validation and refinement of endmembers using an n-dimensional visualizer to ensure optimal spectral separation (Clark, R.N.1999; Bishop, J.L.et al.2005).
3.2. Spectral Angel Mapper Method
The Spectral Angle Mapper (SAM) is a method used to directly compare the spectral reflectance of an image pixel with a reference spectrum or endmember. It processes spectral vectors by calculating the spectral angle between them[33]. The SAM algorithm is insensitive to illumination variations, as it relies solely on the direction of the spectral vector rather than its magnitude. This method is widely applied for identifying lithology and mineralogy and performs effectively in homogeneous regions (Kruse, F.et al.1993).
The angle θ between the spectral vectors t and r is zero (θ = 0) when the vectors are identical. When t and r are perpendicular , the spectral angle reaches its maximum. Here, t and r are defined as:t = (t1, t2, t3, ..., , where the components represent reflectance values across n spectral bands.
3.3. Support Vector Machine
The Support Vector Machine (SVM) was introduced in machine learning theory for solving regression and classification problems and has been widely applied to multispectral data (Farag, A.A.et al.2009) and hyperspectral image classification (Gualtieri, J.A.2009; Melgani, F et al.2009; Lennon, M.et al.2012). SVM can also be generalized to compute nonlinear decision surfaces. The method involves projecting data into a higher-dimensional space, where the data becomes linearly separable. To enable nonlinear classification, SVM employs kernel machine theory, which maps input vectors into a high-dimensional feature space. In this transformed space, the data points achieve linear separability (Murphy, R.J.2012).
The most popular kernel functions are the dthdegree polynomial kernel:
and the Radial Basis Function (RBF):
A first-order polynomial kernel (d=1) corresponds to a linear kernel. The Radial Basis Function (RBF) kernel maps input data vectors to an infinite-dimensional feature space (Boser, B.et al.1992; Cortes, C.et al.1995).
3.4. Technical route of this research
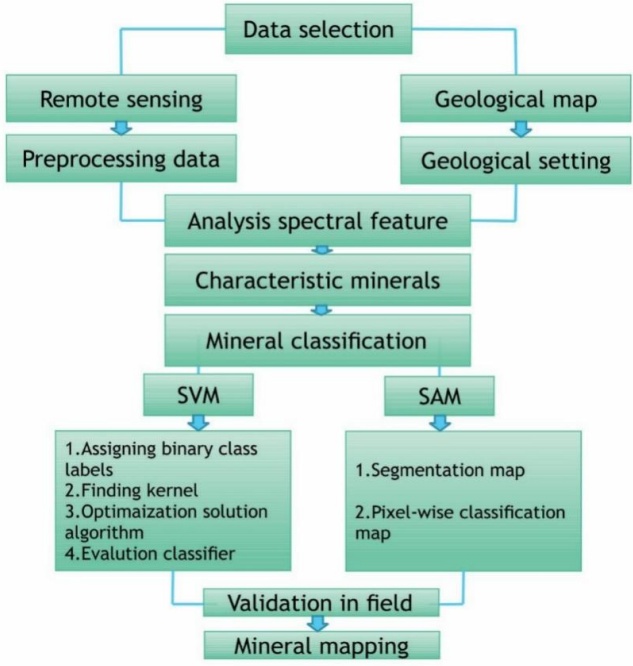
Finally, an effective model for altered mineral extraction can be established through comparative analysis. The methodology (or workflow) of this research is summarized in Fig. 4, which includes the following steps: data selection, spectral feature analysis, characteristic mineral identification, mineral classification, field validation, and mineral mapping.
3.5. ASD spectral analyses
We established nine checkpoints in our study area to collect rock samples for analysis. Our focus, however, was on two types of alteration zones: chlorite and jarosite. Samples from these zones were collected in the field and investigated in the laboratory using ASD spectral analyses. Descriptions and photographs of the samples are provided in Fig. 5 and Table 1.
The spectra of the samples were measured using a FieldSpec3 spectroradiometer (Analytical Spectral Device). Technical specifications and details of the experimental apparatus are provided in Table 3. The experimental procedure followed the ViewSpecPro user manual. The spectrometer was connected to a Windows® 7 64-bit laptop (instrument controller), and a predefined measurement schedule was configured. The spectral acquisition software was used to record and process the data. The sampling interval was 1.4 µm across the 3.50–1.00 µm wavelength range and 2 µm across the 1.00–2.50 µm wavelength range. Rock samples were measured at 10 random locations, and an average representative spectrum for each sample was obtained.
Furthermore, the samples were measured under artificial light (using an accessory light source) rather than sunlight. Prior to data collection, a white reference test was conducted using the RS3™ software (ASD Inc.), which automatically calibrates the system. The derived datasets were then converted into text files via ViewSpecPro and RS3 software. These text files were subsequently imported and processed in ENVI 5.1 software.
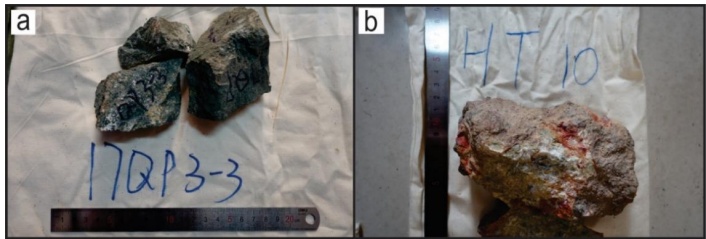
Fig. 5 Shows photos of the rock samples: (a) 17QP 3-3 (D) and (b) HT-10 (F). Descriptions of the samples are provided in Table 1.
4. 4. Results
4.1. End-member spectrum
For subsequent processing, we applied the Minimum Noise Fraction (MNF) transformation method to segregate noise, reduce computational requirements, and lower the inherent dimensionality of the image data. The n-dimensional visualizer was used for interactive selection of endmembers in n-space, linked to the MNF transformation. Pixel Purity Index (PPI) tools were employed to identify the purest pixels and most extreme spectral responses in the dataset, enabling the classification of pixel groups into distinct classes within the hyperspectral image data.
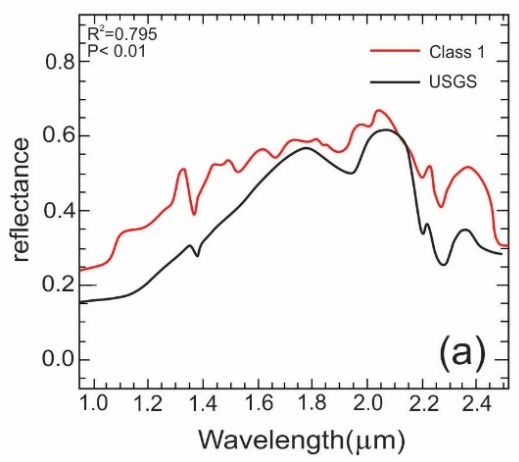
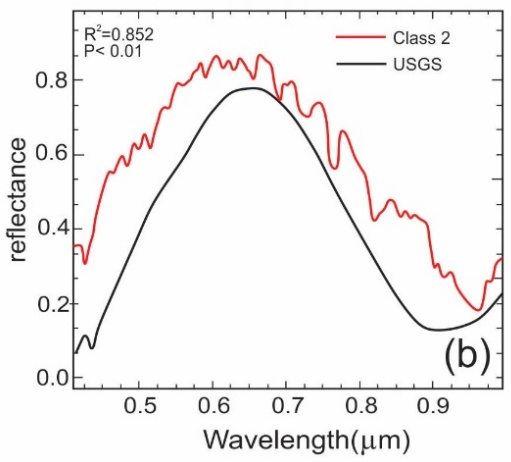
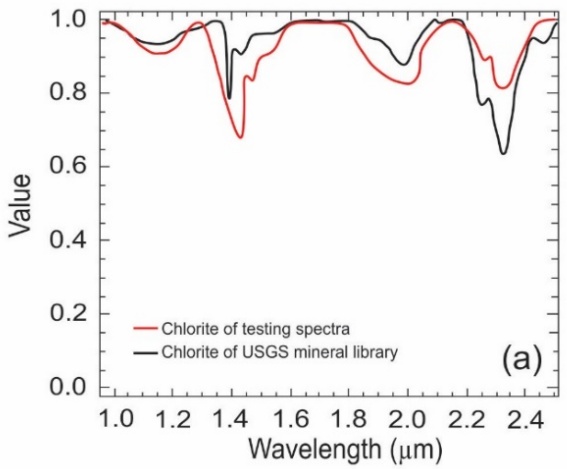
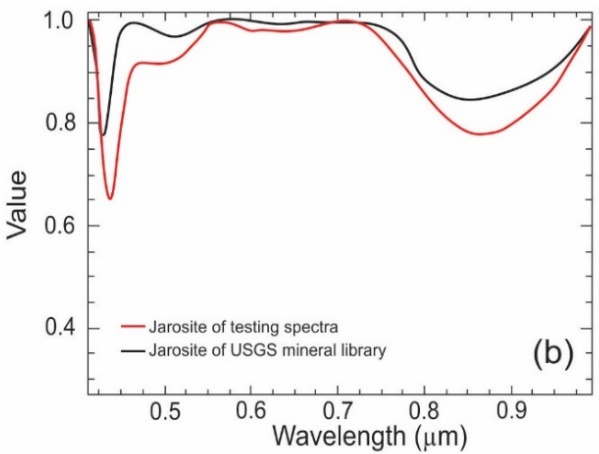
The primary target minerals extracted in this study are chlorite and jarosite. Chlorite, a phyllosilicate mineral, exhibits characteristic absorption features in the SWIR region (around 2.25-2.35 µm) due to vibrational processes of Mg-OH and Fe-OH bonds. Jarosite, a ferric sulfate mineral, shows distinct absorption features in the VNIR region (centered near 0.43 µm, 0.65 µm, and 0.92 µm) caused by electronic transitions of ferric ions (Fe³⁺). Figure 6 presents a comparative analysis between the endmember spectra extracted from the HySpex data and the corresponding standard spectra from the USGS spectral library. The results confirm a significant statistical correlation between the image-derived endmembers and the reference spectra (p < 0.01).
Table 3. Analytical Spectral Device parameters.
| Specification | Parameter |
| Wavelength range | 350-2500 nm |
| Resolution | 3 nm @ 700 nm / 6 nm @ 1400-2100 nm |
| Stray light | VNIR: 5000:1(0.02%) nm NIR: 10000:1 (0.01%) nm |
| Channels | 2151 |
| VNIR detector | (350-1000nm) 512 element silicon array |
| SWIR 1 & 2 detectors | (1001-1800 nm) & (1801-2500 nm) Graded Index In GaAs Photodiode,TE Cooled |
| Dimensions | (H x W x D) 12.7 x 36.8 x 29.2 cm (5 x 14.5 x 11.5 in) |
(a) Chlorite
(b) Jarosite
Class 1 (Chlorite): The spectrum extracted from the HySpex SWIR-384i sensor (Fig. 6a) shows a strong correlation (R² = 0.795) with the USGS chlorite reference. The overall shape and the position of the key absorption feature near 2.25-2.35 µm are well-matched. However, the absolute reflectance values of the image endmember are consistently higher than the library spectrum, with an average difference of 0.28. This systematic offset is common in remote sensing and can be attributed to factors like surface roughness, grain size differences, or residual effects from atmospheric correction. Crucially, the spectral shape in the diagnostically important 1.80–2.50 µm range is very similar, confirming the successful identification of chlorite. Class 2 (Jarosite): The spectrum extracted from the HySpex VNIR-1024 sensor (Fig. 6b) shows an even stronger correlation (R² = 0.852) with the USGS jarosite reference. The absorption features related to Fe³⁺ are clearly identified and aligned. Although the image endmember also has a higher absolute reflectance (average difference of 0.19), its overall shape and the depth of the diagnostic absorption features correspond very closely to the library standard. This high degree of similarity, particularly in the 0.40–1.00 µm range where jarosite has its key spectral signatures, provides high confidence in the identification. In summary, Class 1 is identified as Chlorite based on its SWIR spectral characteristics, and Class 2 is identified as Jarosite based on its VNIR ferric iron features. The consistent offset in absolute reflectance does not detract from the mineral identification, which relies primarily on the shape and position of the absorption features, both of which show excellent agreement with the reference standards.Overall, the spectral data exhibited a significant reduction in correlation. To further analyze the absorption characteristic positions of the minerals, both the reference spectra and endmember spectra were processed using continuum removal (Fig. 7). The endmember spectra align closely with the characteristic absorption positions of the reference spectra across both spectral ranges. Notably, Class 1 displays a broad absorption feature in the 1.85–2.50 µm wavelength range.
(a) Chlorite
(b) Jarosite
The hydroxyl groups in the shortwave infrared (SWIR) range show strong spectral similarity to chlorite, likely due to absorption features associated with carbonate bonding (Fig. 7a). The characteristic absorption valley of chlorite occurs at approximately 2.320 µm, consistent with the spectral analysis. Class 1 exhibits three deep absorption valleys in the 1.250–1.600 µm range, with primary absorption features at 1.100 µm, 1.450 µm, and 2.250 µm. Secondary absorption valleys are observed in the 1.780–2.100 µm range, while the water absorption feature is centered in the 1.250–1.500 µm range. A third absorption valley spans 2.200–2.500 µm, displaying two distinct peaks: the first corresponds to the Al-OH group, and the second aligns with the Mg-OH absorption position. Class 2, resembling jarosite, shows broad absorption in the 0.760–1.000 µm wavelength range, attributed to OH groups (Fig. 7b). Additionally, two absorption valleys are present in the 0.400–0.560 µm range: a sharp valley at 0.440 µm and a broader, more scattered valley near 0.490 µm. The endmember spectra of both minerals exhibit characteristic absorption positions in the shortwavelength (SWIR) and visible-near infrared (VNIR) ranges, demonstrating strong agreement with the corresponding USGS spectral library reference spectra.
4.2. ASD Spectral Analysis and Validation
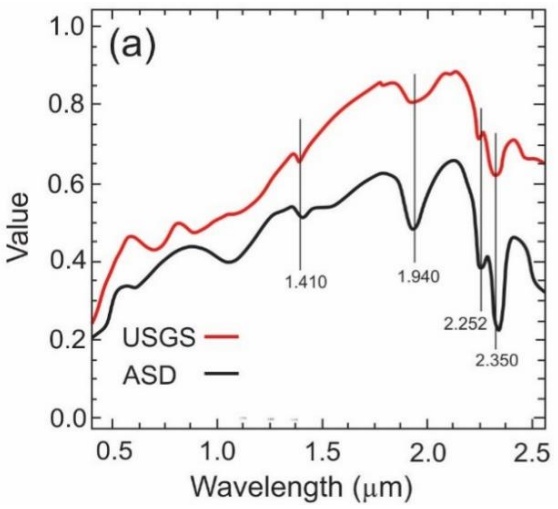
The reference tests were analyzed using a spectral analysis procedure in ENVI 5.1 software. Results were compared through visual inspection of laboratory spectra from field samples and the USGS spectral library. Figure 8 illustrates the spectral analysis of rock samples, which exhibited minor absorption features. The samples display distinctive absorption features with similar spectral shapes, though their spectra are not identical. For chlorite, spectral absorption peaks were compared with the USGS library, revealing pronounced absorption in the 2.252–2.350 µm range due to Al-OH and Fe/Mg-OH bonding. Additional absorption features include a peak at 1.940 µm (attributed to OH⁻ ions) and 1.410 µm (associated with water absorption) (Fig. 8a).
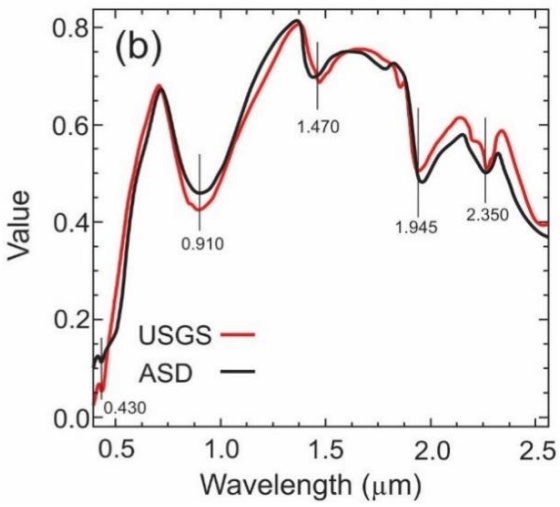
The jarosite spectrum shows a strong Fe³⁺ absorption feature at 0.910 µm, a narrow feature at 0.430 µm, and prominent absorption valleys near 1.470 µm, 1.945 µm, and 2.350 µm (Fig. 8b). Data from the HySpex imagery and ASD field spectrometer align well with the USGS spectral library, confirming consistency in spectral signatures.
(a) Chlorite
(b) Jarosite
4.3. Classification of the spectral libraries
Spectral Angle Mapper (SAM) classification was performed using ENVI 5.1 software.
The maximum angle threshold (in radians) was set as the input parameter, defining the maximum acceptable spectral angle between the training spectrum and pixel vectors. After testing multiple angle thresholds for each class, a single angle threshold of 0.5 radians was selected for optimal classification. At 0.2 radians, the classification left many pixels unclassified due to the overly restrictive threshold, while 0.4 radians resulted in mineral misclassification. The 0.5-radian threshold provided the most suitable balance, minimizing unclassified pixels while reducing errors, and was therefore applied in the final classification.
Support Vector Machine (SVM) classification was performed using SVM software with a Gaussian radial basis function (RBF) kernel. For parameterization, feature values were scaled to a range of 0–1. Hyperparameters γ (gamma) and C were tested across a predefined range of values to optimize classification performance. Optimal γ and C values for the RBF kernel were determined through five-fold cross-validation. The model with the smallest γ value and highest cross-validation accuracy was selected, as γ controls the kernel width. Smaller γ values increase the influence radius of support vectors (reducing overfitting), while higher γ values improve training accuracy by tightly fitting the model to the training data. Final parameters of γ = 2⁻¹⁴ and C = 225 were used for classification, balancing generalization and accuracy.
The final comparison of the two classification methods was conducted using the F-measure, which combines precision and recall, and the kappa coefficient of agreement (Crestani, F.et al.1998; Hudson, W.D.et al.1987). The F-measure results indicated that the Spectral Angle Mapper (SAM) performed most effectively in classifying chlorite, while the kappa coefficient demonstrated low sensitivity for jarosite (Table 4). These findings have two key implications for SAM-based classification of hyperspectral imagery in mine faces:
1) Variability in optimal spectral angle: Differences in optimal angular thresholds between spectral libraries and rock types suggest that a single angular threshold cannot be universally applied to classify all rock types under varying illumination conditions.
2) Reference spectrum limitations: Inconsistent classification performance across reference spectra implies that no single reference spectrum can serve as a "typical" representative for any rock type.
To classify the spectral libraries, SVMs were applied to each rock type using a one-against-all approach without employing the winner-takes-all decision. The parameters for each kernel—polynomial and RBF—were optimized to maximize the averaged performance of the one-against-all binary classifiers. For the polynomial kernel, the first-degree polynomial demonstrated the best overall performance (Table 4). Overall, SVM significantly outperformed SAM in classifying rocks across all test libraries.
Fig. 9 shows the classification results of SAM (58.03% accuracy) and the corresponding Kappa coefficient index of 0.50 (Table 5).The analysis of alteration distribution revealed that most jarosite areas were distributed around the trenches, exhibiting a linear trend along their paths. Chlorites were predominantly located in the hills northeast of the trenches, with the remainder scattered in the surrounding hills.
Table 4 Classification Performance of SAM and SVM
| Rock type | F-measure | Kappa | ||
| Chlorite | SAM0.644(3) | SVM0.975(1) | SAM0.49(3) | SVM0.68(1) |
| Jarosite | 0.567(5) | 0.854(7) | 0.51(2) | 0.60(4) |
| Overall | 0.605 | 0.905 | 0.50 | 0.64 |
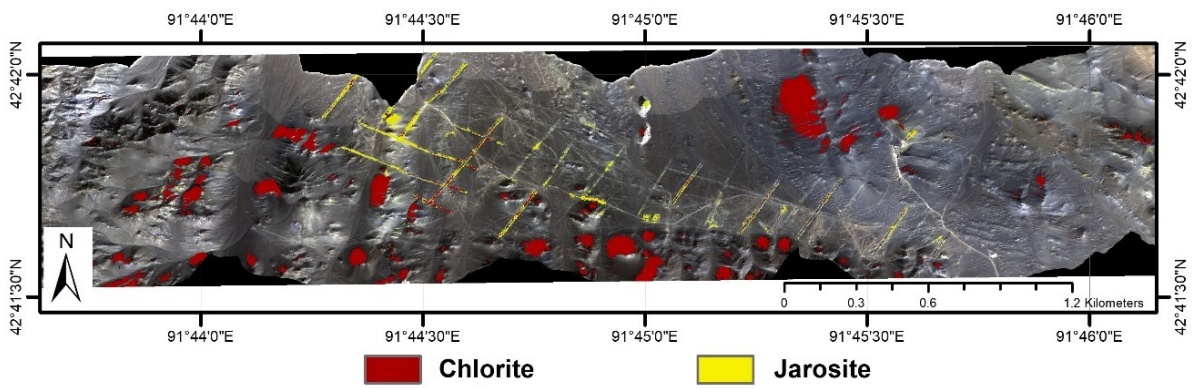
Fig. 9 Spectral Angle Mapper (SAM) alteration extraction results.
The SVM classification achieved 69.25% accuracy with a Kappa index of 0.64 (Fig. 10, Table 5). A manually created slope mask was applied to correct inclination errors, which improved classification accuracy. The key distinction between SVM and SAM lies in their handling of the original slope data. Overall classification accuracies improved by 4.3% for SAM (to 59.57%) and reached 69.25% for SVM (Table 4).
4.4. Verification Analysis
After extracting the alteration zones, field verification of the results is required to ensure their credibility. To evaluate the reliability of the alteration extraction, we collected nine samples from nine checkpoints (Fig. 11). Points D, E, and F are located in the concentrated alteration area identified by both SVM and SAM. In contrast, Points A and I are situated in areas where the two types of alteration were not extracted due to coverage by aeolian and slope gravels. Points B, C, G, and H are located within the alteration distribution zones.
Representative verification points and a non-alteration area were selected for each of the two alteration zones within the study area for field verification, as shown in Fig. 12. In photos a, c, and d, the hills in the southwestern part of the study area exhibit chlorite chemical indices in their upper sections, with weathered rocks visible around the trenches. These observations align with the alteration extraction results. However, in photos b and i, no alteration is present due to coverage by aeolian and slope gravels, which corroborates our findings. Photo e reveals limonite and jarosite mineralization (Fig. 12 e), though the alteration extraction along the trench does not indicate a uniform distribution of jarosite. Instead, scattered jarosite distribution was observed in certain areas (Fig. 12 f), as reflected in the alteration extraction classification map (Fig. 10). During field observations, additional altered rocks, such as limonite and gabbro, were documented (Fig. 12 g, h).
The results of altered mineral extraction were integrated with field verification. The SVM method produced concentrated distributions of altered minerals, supported by field observations. Similarly, the SAM method yielded dispersed distributions, which were also consistent with field data. In areas of alteration and concentration, altered mineral distributions derived from these methods align with field-observed patterns.
Table 5. Comparison methods accuracies.
| Classification | Accuracy (%) | Kappa-Coefficient |
| SAM | 58.48 | 0.50 |
| SAM with original slope | 58.03 | 0.49 |
| SAM with manual slope | 59.06 | 0.50 |
| SVM | 69.25 | 0.64 |
| SVM with original slope | 69.45 | 0.60 |
| SVM with manual slope | 70.02 | 0.67 |
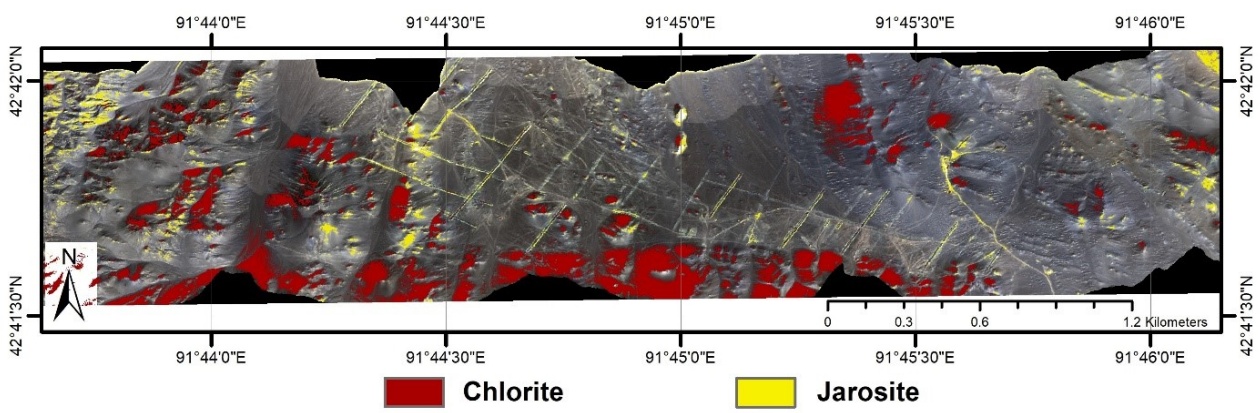
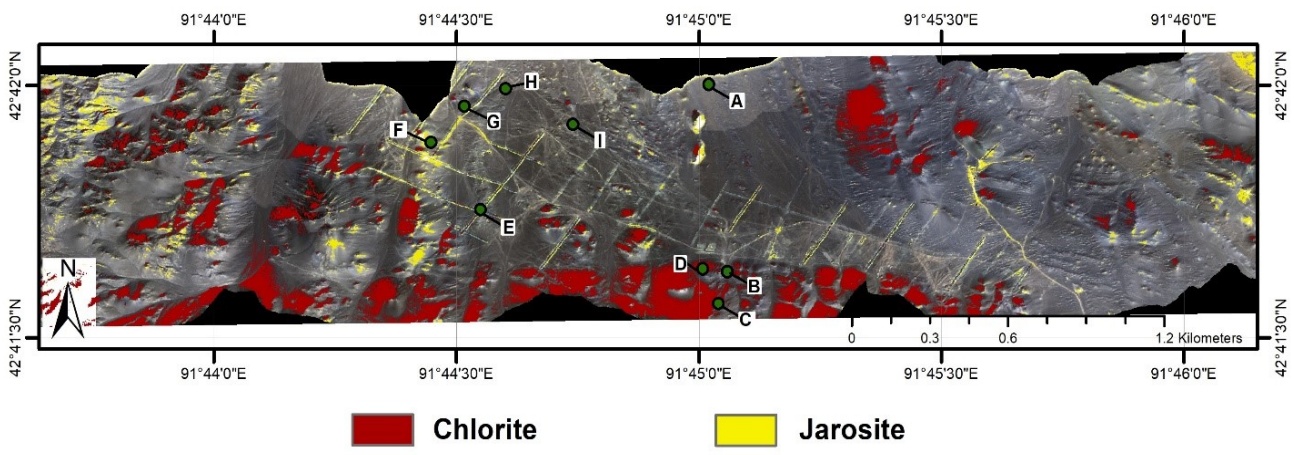
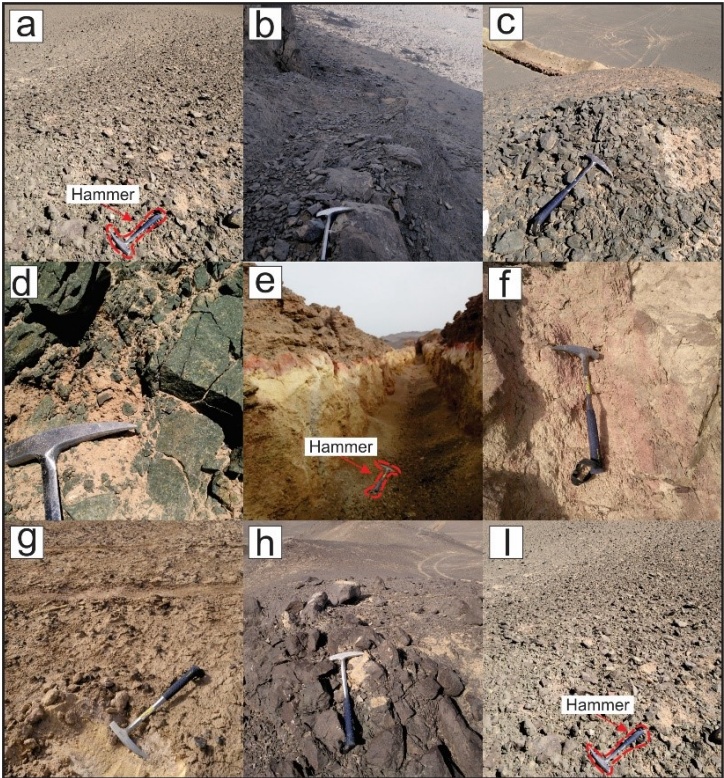
Fig. 12 Photos of the verification check points from Yudai Kalatage, Xinjiang (China): (a) HT-11 (b) 17QP 2-1 (c) 17QP 2-2 (d) 17QP 3-3 (e) 17QP 3-4 (f) HT-10 (g) 17QP 3-6 (h) 17 JY-3 (i) 17QP 3-5 description of the samples are given in Table 1.
5. Discussion
The purpose of this study was to implement a lowaltitude hyperspectral method for extracting alteration information using an ultra-low altitude, high-precision rapid detection technology platform. Airborne, field, and laboratory measurements produced mineral maps identifying predominant spectral mineral classes, specifically chlorite and jarosite. The identification of these minerals was supported by Analytical Spectral Devices (ASD) data, confirming consistency with the USGS spectral library (Fig. 8). Through comparative analysis, higher-quality sample datasets were selected to extract alteration information in the study area. Guo et al. 2019 previously studied HySpex hyperspectral mineral mapping in the Hami area, focusing on spectrally predominant iron-stained altered minerals such as limonite, jarosite, and goethite. Their results displayed similarity across three levels of data collection. In this study, reference spectra were interactively selected from image data at each collection level to define mineral classes. Mineral mapping prioritized iron-bearing minerals with diagnostic absorption features in the VNIR and SWIR wavelength ranges (400–2500 nm). The study area’s surface, affected by weathering, comprises ground gravel, altered gabbro, feldspar, chlorite, limonite, and jarosite, as documented by airborne HySpex imaging and field observations (Fig. 12, Table 1). HySpex hyperspectral data were enhanced using Minimum Noise Fraction (MNF) transformation to reduce noise and coupled with the Pixel Purity Index (PPI) to extract endmembers of mineral classes in ndimensional space. Spectral alignment was achieved by comparing wavelength positions between the ASD and USGS spectral libraries (Figs. 6 and 8). Recognizing and quantifying minor spectral differences between spectrometers enabled data alignment and comparison of absorption feature positions across instruments.
SVM consistently outperformed SAM in classifying library spectra of rocks, demonstrating its superiority over other classification methods (e.g., (Foody, G.M.et al.2004; Huang, C.et al.2002)). For SAM classification, the optimal angular threshold varied across test libraries and performance metrics. Consequently, multiple angle thresholds were tested, and 0.5 radians was selected as the most suitable value for classification. The performance of the SVM method also varied across test libraries. To classify the spectral libraries, parameters for each kernel (polynomial and RBF) were optimized to maximize the average performance across all binary classes. After five-fold cross-validation, the optimal parameters for SVM classification were determined as and C=225. These parameters were subsequently applied, confirming that SVM significantly outperformed SAM in classifying rocks across all test libraries (Table 4).
Despite the overall success of the methodology, this study has several limitations. Firstly, the high spatial resolution (~1 m) of the HySpex data, while advantageous for detailed mapping, results in a large number of mixed pixels at mineral boundaries and in areas with intimate mineralization, which can challenge the accurate extraction of pure endmembers. Secondly, the spectral classification, particularly the SVM, is sensitive to the quality of the input training data. The selection of optimal parameters (γ and C) is dataspecific, and the process, though rigorous, requires significant computational time and expertise to avoid overfitting. Furthermore, the presence of widespread salt-alkali crust and vegetation cover in parts of the study area can mask the underlying mineralogical signatures, leading to potential misclassification or an underestimation of alteration extent. These factors represent inherent challenges in applying hyperspectral remote sensing in complex natural environments.
Following the on-site investigation, we observed extensive jarosite exposure around the trench and in spatially extensive mono-mineralized zones. A small amount of chlorite was identified on the hilltop near the trench, while the remaining area was predominantly covered by a thick salt-alkali crust with minimal alteration. The altered mineral extraction results, combined with field verification, reveal that the distributions of altered minerals extracted using the Support Vector Machine (SVM) method are more concentrated and spatially coherent, whereas those derived from the Spectral Angle Mapper (SAM) are more dispersed. In alteration zones, the altered mineral distributions identified by both methods align with fieldobserved alteration patterns. The results demonstrate that SVM classification is more accurate and sensitive than SAM for identifying metamorphic minerals. Additionally, SVM-based alteration extraction showed stronger agreement with field verification. These findings are consistent with studies by Murphy et al. 2012 and Huang et al. 2002, which reported SVM’s superior performance over SAM in classifying rock spectra acquired via low-altitude detection. This further supports SVM as a robust method for classifying alteration zones. Overall, SVM achieves higher accuracy and sensitivity in recognizing altered minerals compared to SAM.
The results of this study demonstrate that the ultralow altitude HySpex hyperspectral platform can effectively detect altered minerals and be used to establish a qualitative relationship between spectral signatures and mineral element content. In subsequent research, we plan to apply this technology to large-scale metallogenic belt surveys to identify rock types and their mineral composition, while also developing strategies to mitigate the limitations identified herein, such as employing spectral unmixing techniques to address mixed pixels.
6. Conclusions
HySpex hyperspectral data, acquired from a superlow altitude platform, were used to identify alteration zones and map minerals by analyzing spectral wavelengths. Endmember spectra derived from the images demonstrated strong similarity to the USGS spectral library, supported by accuracy reference spectra and quantitative descriptions. The ASD mineral analyses showed good agreement with the HySpex hyperspectral results, further validating the data. Altered minerals were extracted using the Spectral Angle Mapper (SAM) and Support Vector Machine (SVM) methods, both of which performed effectively in screening field backgrounds. Field verification revealed an agreement accuracy of 69.25% for SVM, indicating robust performance. While SAM also successfully identified mineral alterations, its accuracy was lower at 59.57%, reflecting reduced reliability under field validation.
In summary, super-low altitude HySpex hyperspectral detection platforms enable the acquisition of continuous, high-resolution spectral target curves at sub-meter spatial resolution. This technology provides critical technical support for studying quantitative and semi-quantitative relationships between targets and is highly effective for mineral deposit prospecting.
Author Contributions: Kefa Zhou supervised the project. Shanshan Wang conducted the field survey and validated the results using field data. Furkat Vatanbekov wrote the manuscript and analyzed the results using programs developed. Dzhovid Yogibekov contributed to the geological context and participated in drafting the manuscript. All authors discussed the findings and provided critical feedback on the manuscript.
Conflict of Interest: The author(s) confirm(s) that there is no conflict of interest related to the manuscript.
References
Adão, T.; Hruška, J.; Pádua, L.; Bessa, J.; Peres, E.; Morais, R.; Sousa, J.J. Hyperspectral imaging: A review on UAV-based sensors, data processing and applications for agriculture and forestry. Remote Sensing 2017, 9, 1110. Back to citation
Baissa, R.; Labbassi, K.; Launeau, P.; Gaudin, A.; Ouajhain, B. Using HySpex SWIR-320m hyperspectral data for the identification and mapping of minerals in hand specimens of carbonate rocks from the Ankloute Formation (Agadir Basin, Western Morocco). Journal of African Earth Sciences 2011, 61, 1-9. 1 2 3
Bedini, E. The use of hyperspectral remote sensing for mineral exploration: A review. Journal of Hyperspectral Remote Sensing 2017, 7, 189-211. Back to citation
Bishop, C.A.; Liu, J.G.; Mason, P.J. Hyperspectral remote sensing for mineral exploration in Pulang, Yunnan Province, China. International Journal of Remote Sensing 2011, 32, 2409-2426. 1 2
Bishop, J.L.; Murad, E. The visible and infrared spectral properties of jarosite and alunite. American Mineralogist 2005, 90, 1100-1107. Back to citation
Boardman, J.; Kruse, F. Automated spectral analysis: a geological example using AVIRIS data, north Grapevine Mountains, Nevada: in Proceedings, ERIM Tenth Thematic Conference on Geologic Remote Sensing. Environmental Research Institute of Michigan, Ann Arbor, MI, pp. I-407-I-418 1994. 1 2
Boardman, J.W. Automating spectral unmixing of AVIRIS data using convex geometry concepts. 1993. Back to citation
Boser, B.; Guyon, I.; Vapnik, V. A training algorithm for optimal margin classifiers. Proceedings of the fifth annual workshop on Computational learning theory; Pittsburgh, Pennsylvania, USA. 130401: ACM. 1992. Back to citation
Chehdi, K.; Soltani, M.; Cariou, C. Pixel classification of large-size hyperspectral images by affinity propagation. Journal of applied remote sensing 2014, 8, 083567. 1 2
Chen, D.; Yang, D.; Zhang, X.; Zhao, Y.; Zhang, Y. Spatial Suitability Evaluation of an Arid City Based on the Perspective of Major Function Oriented Zoning: A Case Study of Urumqi City in Xinjiang, China. Sustainability 2018, 10, 3004. Back to citation
Chen, L.; Wang, J.-B.; Bagas, L.; Wu, X.-B.; Zou, H.-Y.; Zhang, H.-Q.; Sun, Y.; Lv, X.-Q.; Deng, X.-H. Significance of adakites in petrogenesis of Early Silurian magmatism at the Yudai copper deposit in the Kalatag district, NW China. Ore Geology Reviews 2017, 91, 780-794. 1 2
Clark, R.N. Spectroscopy of rocks and minerals, and principles of spectroscopy. Manual of remote sensing 1999, 3, 2-2. Back to citation
Cortes, C.; Vapnik, V. Support-vector networks. Machine learning 1995, 20, 273-297. Back to citation
Crestani, F.; Lalmas, M.; Van Rijsbergen, C.J.; Campbell, I. “Is this document relevant?… probably” a survey of probabilistic models in information retrieval. ACM Computing Surveys (CSUR) 1998, 30, 528-552. Back to citation
Crowley, J.; Williams, D.; Hammarstrom, J.; Piatak, N.; Chou, I.-M.; Mars, J. Spectral reflectance properties (0.4–2.5 μm) of secondary Fe-oxide, Fe-hydroxide, and Fesulphate-hydrate minerals associated with sulphidebearing mine wastes. Geochemistry: Exploration, Environment, Analysis 2003, 3, 219-228.
Deng, X.-H.; Wang, J.-B.; Pirajno, F.; Wang, Y.-W.; Li, Y.-C.; Li, C.; Zhou, L.-M.; Chen, Y.-J. Re–Os dating of chalcopyrite from selected mineral deposits in the Kalatag district in the eastern Tianshan Orogen, China. Ore Geology Reviews 2016, 77, 72-81. Back to citation
Deng, X.-H.; Wang, J.-B.; Santosh, M.; Li, Y.-C.; Wang, Y.- W.; Mao, Q.-G.; Long, L.-L.; Chen, X. New 40Ar/39Ar ages from the Kalatag district in the Eastern Tianshan, NW China: Constraints on the timing of Cu mineralization and stratigraphy. Ore Geology Reviews 2018, 100, 250-262.
Deng, X.H.; Wang, J.B.; Santosh, M.; Wang, Y.W.; Long, L.L.; Zhang, H.Q.; Yang, L.Y.; Xu, J.; Chen, X.; Chen, L. Early Paleozoic volcanic rocks with VMS mineralization from eastern Tianshan Orogen: Implication for tectonic evolution. Geological Journal 2018, 53, 2178-2192.
Denk, M.; Gläßer, C.; Kurz, T.H.; Buckley, S.J.; Drissen, P. Mapping of iron and steelwork by-products using close-range hyperspectral imaging: A case study in Thuringia, Germany. European Journal of Remote Sensing 2015, 48, 489-509. 1 2
Erickson, R.L. Characteristics of mineral deposit occurrences; The Survey: 1982. Back to citation
Farag, A.A.; Mohamed, R.M. Classification of multispectral data using support vector machines approach for density estimation. In Proceedings of International Conference on Intelligent Engineering System; pp. 6-8.
FILHO, A.P.C.S.A.C.R.D.S. HYPERSPECTRAL REMOTE SENSING FOR MINERAL MAPPING: A CASE-STUDYAT ALTO PARAÍSO DE GOÍAS, CENTRAL BRAZIL. 2000. Back to citation
Foody, G.M.; Mathur, A. Toward intelligent training of supervised image classifications: directing training data acquisition for SVM classification. Remote Sensing of Environment 2004, 93, 107-117. Back to citation
Fricke, K. Analysis and modelling of water supply and demand under climate change, land use transformation and socio-economic development: The water resource challenge and adaptation measures for Urumqi Region, Northwest China; Springer Science & Business Media: 2013.
Gualtieri, J.A. The support vector machine (SVM) algorithm for supervised classification of hyperspectral remote sensing data. Kernel methods for remote sensing data analysis 2009, 3, 51-83. Back to citation
Guo, J.; Zhou, K.; Wang, J.; Cui, S.; Zhou, S.; Tang, C. Identification of iron-bearing minerals based on HySpex hyperspectral remote sensing data. Journal of Applied Remote Sensing 2019, 13, 047501.
Huang, C.; Davis, L.; Townshend, J. An assessment of support vector machines for land cover classification. International Journal of remote sensing 2002, 23, 725-749. Back to citation
Hudson, W.D. Correct formulation of the kappa coefficient of agreement. Photogrammetric engineering and remote sensing 1987, 53, 421-422. Back to citation
Koerting, F.; Rogass, C.; Kaempf, H.; Lubitz, C.; Harms, U.; Schudack, M.; Kokaly, R.; Mielke, C.; Boesche, N.; Altenberger, U. DRILL CORE MINERAL ANALYSIS BY MEANS OF THE HYPERSPECTRAL IMAGING SPECTROMETER HySpex, XRD AND ASD IN PROXIMITY OF THE MÝTINA MAAR, CZECH REPUBLIC. International Archives of the Photogrammetry, Remote Sensing & Spatial Information Sciences 2015, 40.
Kruse, F.; Lefkoff, A.; Dietz, J. Expert system-based mineral mapping in northern Death Valley, California/Nevada, using the airborne visible/infrared imaging spectrometer (AVIRIS). Remote Sensing of Environment 1993, 44, 309-336. Back to citation
Lenhard, K.; Baumgartner, A.; Schwarzmaier, T. Independent laboratory characterization of NEO HySpex imaging spectrometers VNIR-1600 and SWIR-320m-e. IEEE Transactions on Geoscience and Remote Sensing 2014, 53, 1828-1841. Back to citation
Lennon, M.; Mercier, G.; Hubert-Moy, L. Classification of hyperspectral images with nonlinear filtering and support vector machines. In Proceedings of IEEE International Geoscience and Remote Sensing Symposium; pp. 1670-1672.
Mao, Q. The geological, metallogenesis and metallogenic prognosis studies of the Kalatage copper polymetallic ore district in eastern Tianshan, NW China. Post-Doctoral Research Report 2014, 1-154. Back to citation
Mathieu, M. Alteration mapping on drill cores using a HySpex SWIR-320m hyperspectral camera: Application to the exploration of an unconformity-related uranium deposit (Saskatchewan, Canada). 2017. 1 2 3
Melgani, F.; Bruzzone, L. Support vector machines for classification of hyperspectral remote-sensing images. In Proceedings of IEEE international geoscience and remote sensing symposium; pp. 506-508.
Molan, Y.E.; Refahi, D.; Tarashti, A.H. Mineral mapping in the Maherabad area, eastern Iran, using the HyMap remote sensing data. International Journal of Applied Earth Observation and Geoinformation 2014, 27, 117-127. Back to citation
Murphy, R.J.; Monteiro, S.T.; Schneider, S. Evaluating classification techniques for mapping vertical geology using field-based hyperspectral sensors. IEEE Transactions on Geoscience and Remote Sensing 2012, 50, 3066-3080. 1 2
Murphy, R.J.; Taylor, Z.; Schneider, S.; Nieto, J. Mapping clay minerals in an open-pit mine using hyperspectral and LiDAR data. European Journal of Remote Sensing 2017, 48, 511-526, doi:10.5721/EuJRS20154829. Back to citation
Pour, A.B.; Hashim, M. Identification of hydrothermal alteration minerals for exploring of porphyry copper deposit using ASTER data, SE Iran. Journal of Asian Earth Sciences 2011, 42, 1309-1323.
Salehi, S.; Thaarup, S.M. Mineral mapping by hyperspectral remote sensing in West Greenland using airborne, shipbased and terrestrial platforms. Geological Survey of Denmark and Greenland Bulletin 2017, 47-50. Back to citation
Schwarz, J.; Staenz, K. Adaptive threshold for spectral matching of hyperspectral data. Canadian Journal of Remote Sensing 2001, 27, 216-224.
Vincent, R.K. Fundamentals of geological and environmental remote sensing; Prentice Hall Upper Saddle River, NJ: 1997; Vol. 366. Back to citation
Xiao, W.; Mao, Q.; Windley, B.; Han, C.; Qu, J.; Zhang, J.; Ao, S.; Guo, Q.; Cleven, N.; Lin, S. Paleozoic multiple accretionary and collisional processes of the Beishan orogenic collage. American Journal of Science 2010, 310, 1553-1594. Back to citation
Xiao, W.-J.; Zhang, L.-C.; Qin, K.-Z.; Sun, S.; Li, J.-L. Paleozoic accretionary and collisional tectonics of the Eastern Tianshan (China): implications for the continental growth of central Asia. American Journal of Science 2004, 304, 370-395. 1 2